This week’s challenge looks at products in Tableau’s superstore dataset. In this challenge you will have to find the products that have been profitable in each of the four years in this dataset. That means profitable in 2018, 2019, 2020, and 2021.
Once you have identified successful products (the consistently profitable products) then you will compare them to the other products.
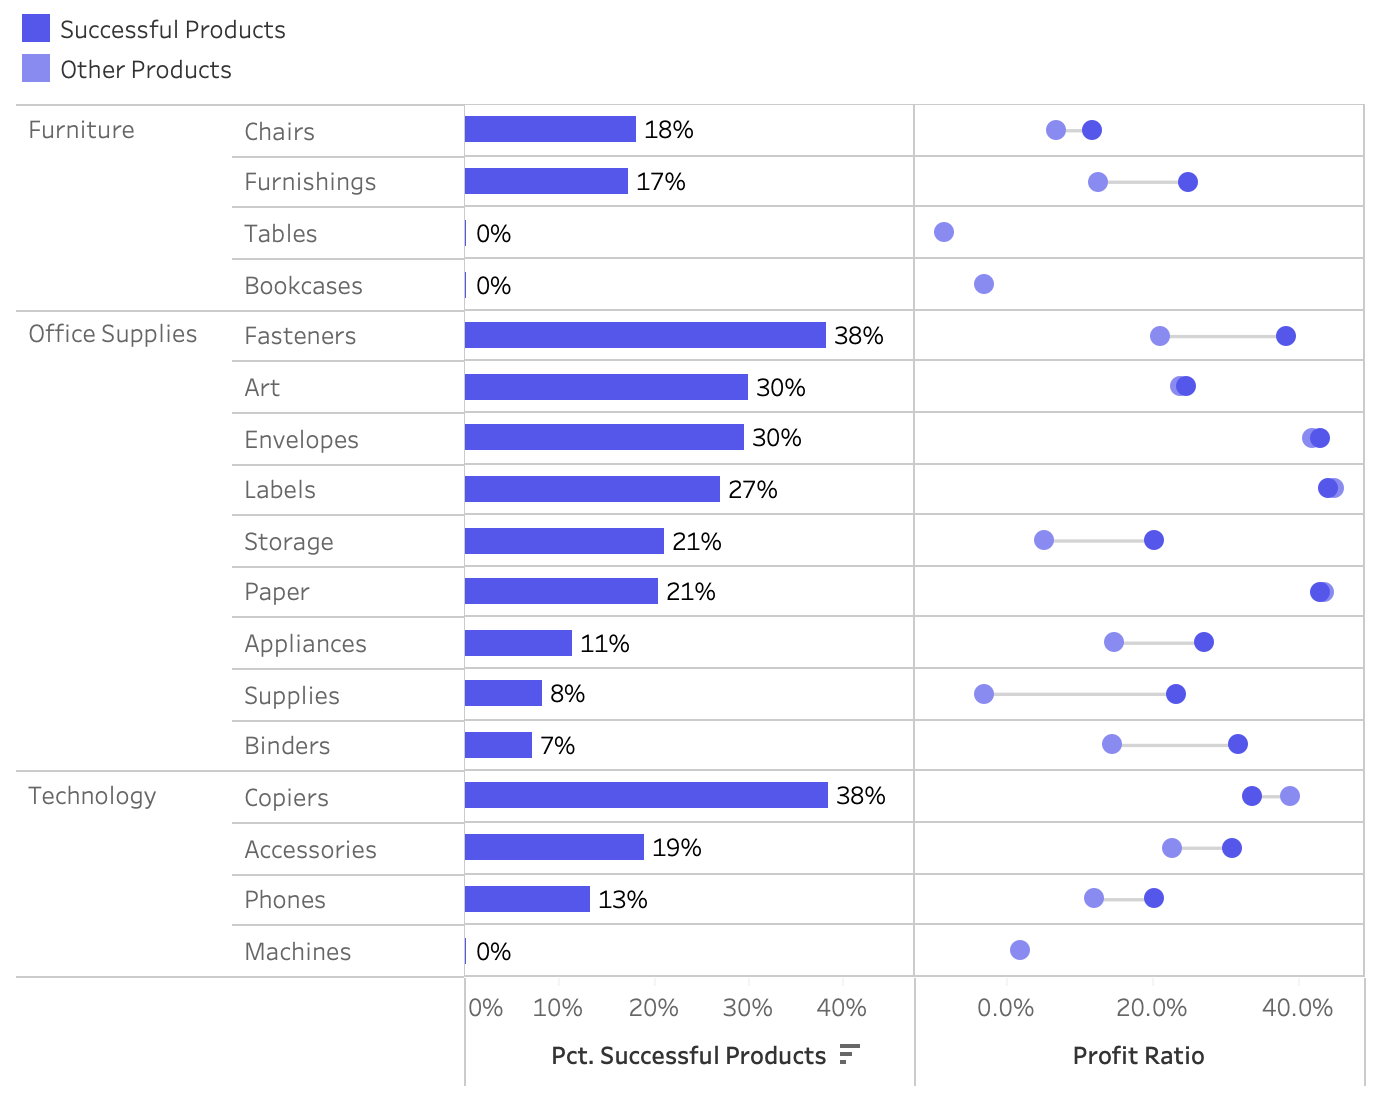
Calculate the percent of products that are successful by Category and Sub-Category with a bar chart
Successful products are profitable each year for the four years of data in this dataset
Compare the profit ratio of the successful products to the other products using a barbell plot.
Match the formatting (#5557EB, #8A8BF1)
Dataset
This week uses the superstore dataset for Tableau 2021.4. You can get it here at data.world
Attribute
When you publish your solution on Tableau Public make sure to take the time and include a link to the original inspiration. Also include the hashtag #WOW2022 in your description to make it searchable!