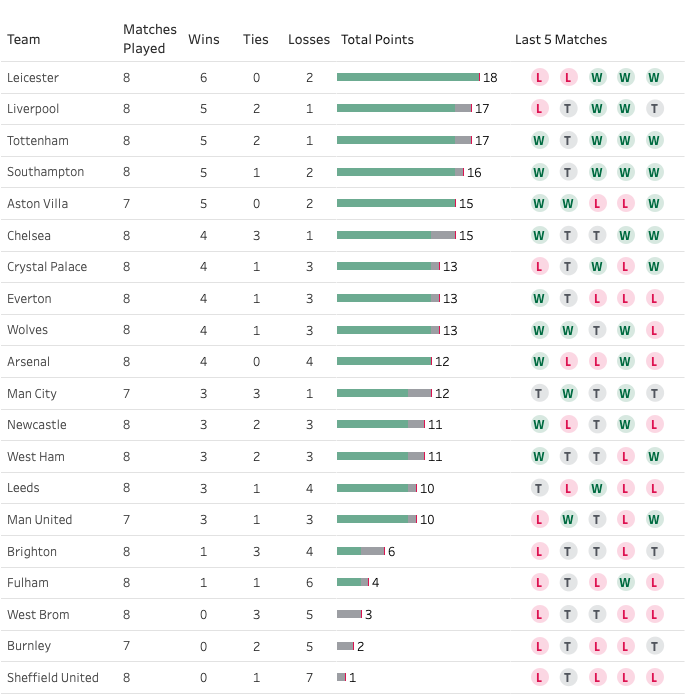
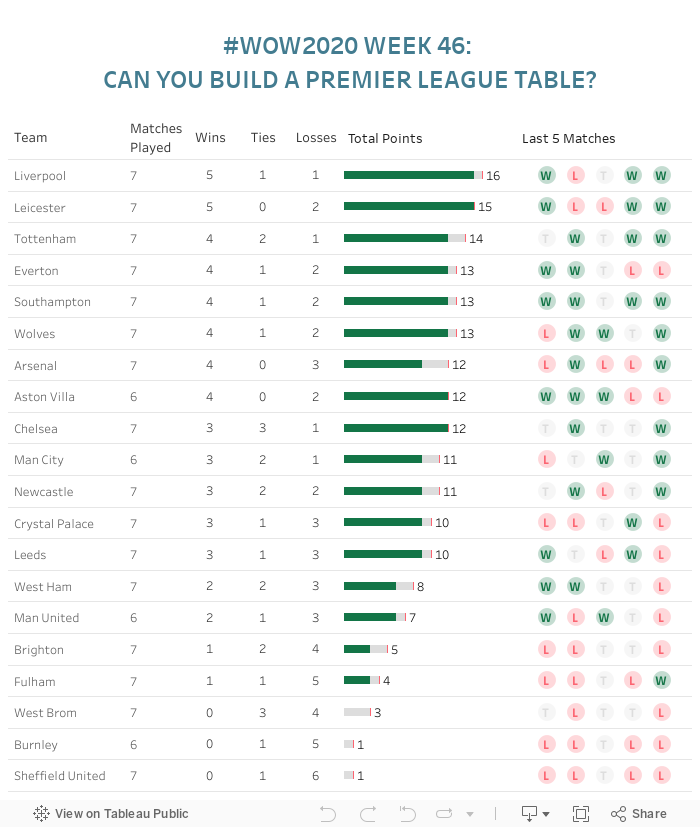
I was scrolling thru my Twitter timeline and noticed a comment by fellow Zen Master Simon Beaumont to #MakeoverMonday co-lead Charlie Hutcheson regarding tables, specifically the kind to track teams and the results of matches in the English Premier League (which are a group of the highest level teams that play football/soccer in England).
Not even a @lukestanke masterclass could make that table look any good!
Create a bar chart showing the total points earned
3 points for a win
1 point for a tie
0 points for a loss
Create a visual showing the outcomes of the last 5 matches where the most recent is on the right side.
Data Help
HomeTeam: The team playing on their own field
AwayTeam: The team not playing on their own field
FTHG: Total goals for the home team
FTAG: Total goals for the away team
Date: Date of the match
Finishing Elements
Sort by total points
Make sure the table looks seamless
Match tooltips, which are pretty simple
Match formatting
Use your choice of colors
Dataset
This week uses the EPL dataset. You can get it here.
Attribute
When you publish your solution on Tableau Public make sure to take the time and include a link to the original inspiration. Also include the hashtag #WOW2020 in your description to make it searchable!