The topic week is based on a recent project of my colleague, Tamás Gáspár, with whom I had the opportunity to make this super challenge for you guys.
Heatmaps are a chart better suited to representing a more generalised view of numerical data, as it’s harder to accurately tell the differences between colour shades and to read specific data points from. This week you need to display the raw data on the selected cells of the heatmap.
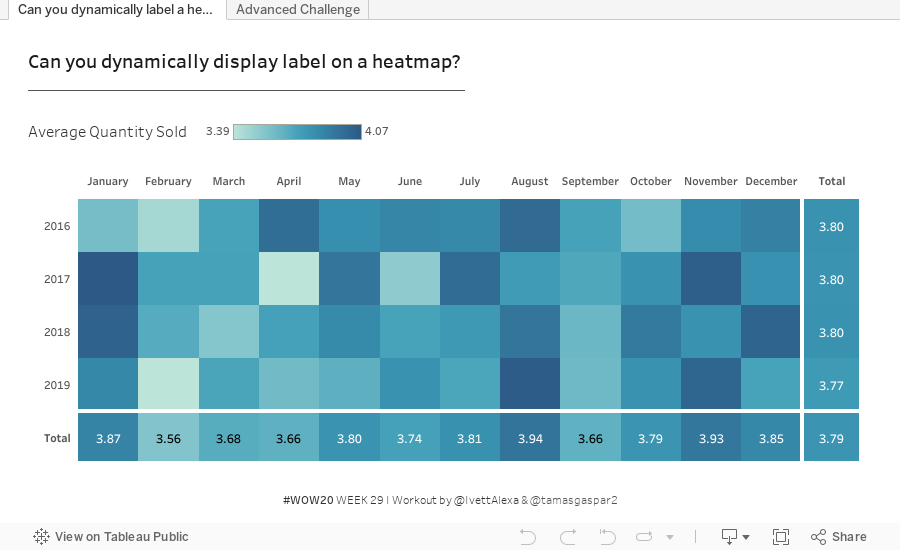
Build a time-based heatmap | Order Year – Order Month
Color means the AVG(Quantity) – Automatic Color
Show Totals by Years and Months
Add Labels to the Total rows Hint: What is the Size() of the totals and the cells?
Show the label of the selected cell on the heatmap Hint: How can you write a calculated field by using values selected by an interaction?
Show the Color Legend
Advanced
Dashboard size: 900 x 500
Make the whole visualization on 1 sheet
Build a time-based heatmap | Order Year – Order Month
Color means the AVG(Quantity) – Automatic Color
Show Totals by Years and Months
Add Labels to the Total rows
Show the label of the selected cell on the heatmap
Show the Color Legend
Highlight the selected cell’s seasonal information, by month and by year. Hint: Set the highlight to a field that has the same value when the month or the year matches with the selected cell.
Make the coloring dynamic. When nothing is selected color by the absolute value, but when a cell is selected color the table by the difference of the cells to the selected cell. Hint: Similar approach as above, but now compare values.
Dataset
This week uses the superstore dataset for Tableau. You can get it here at data.world
Attribute
When you publish your solution on Tableau Public make sure to take the time and include a link to the original inspiration. Also include the hashtag #WOW2020 in your description to make it searchable!