Introduction
Recently I’ve been spending more time working with Map Layers, so this week is dedicated to reimagining maps using this feature.
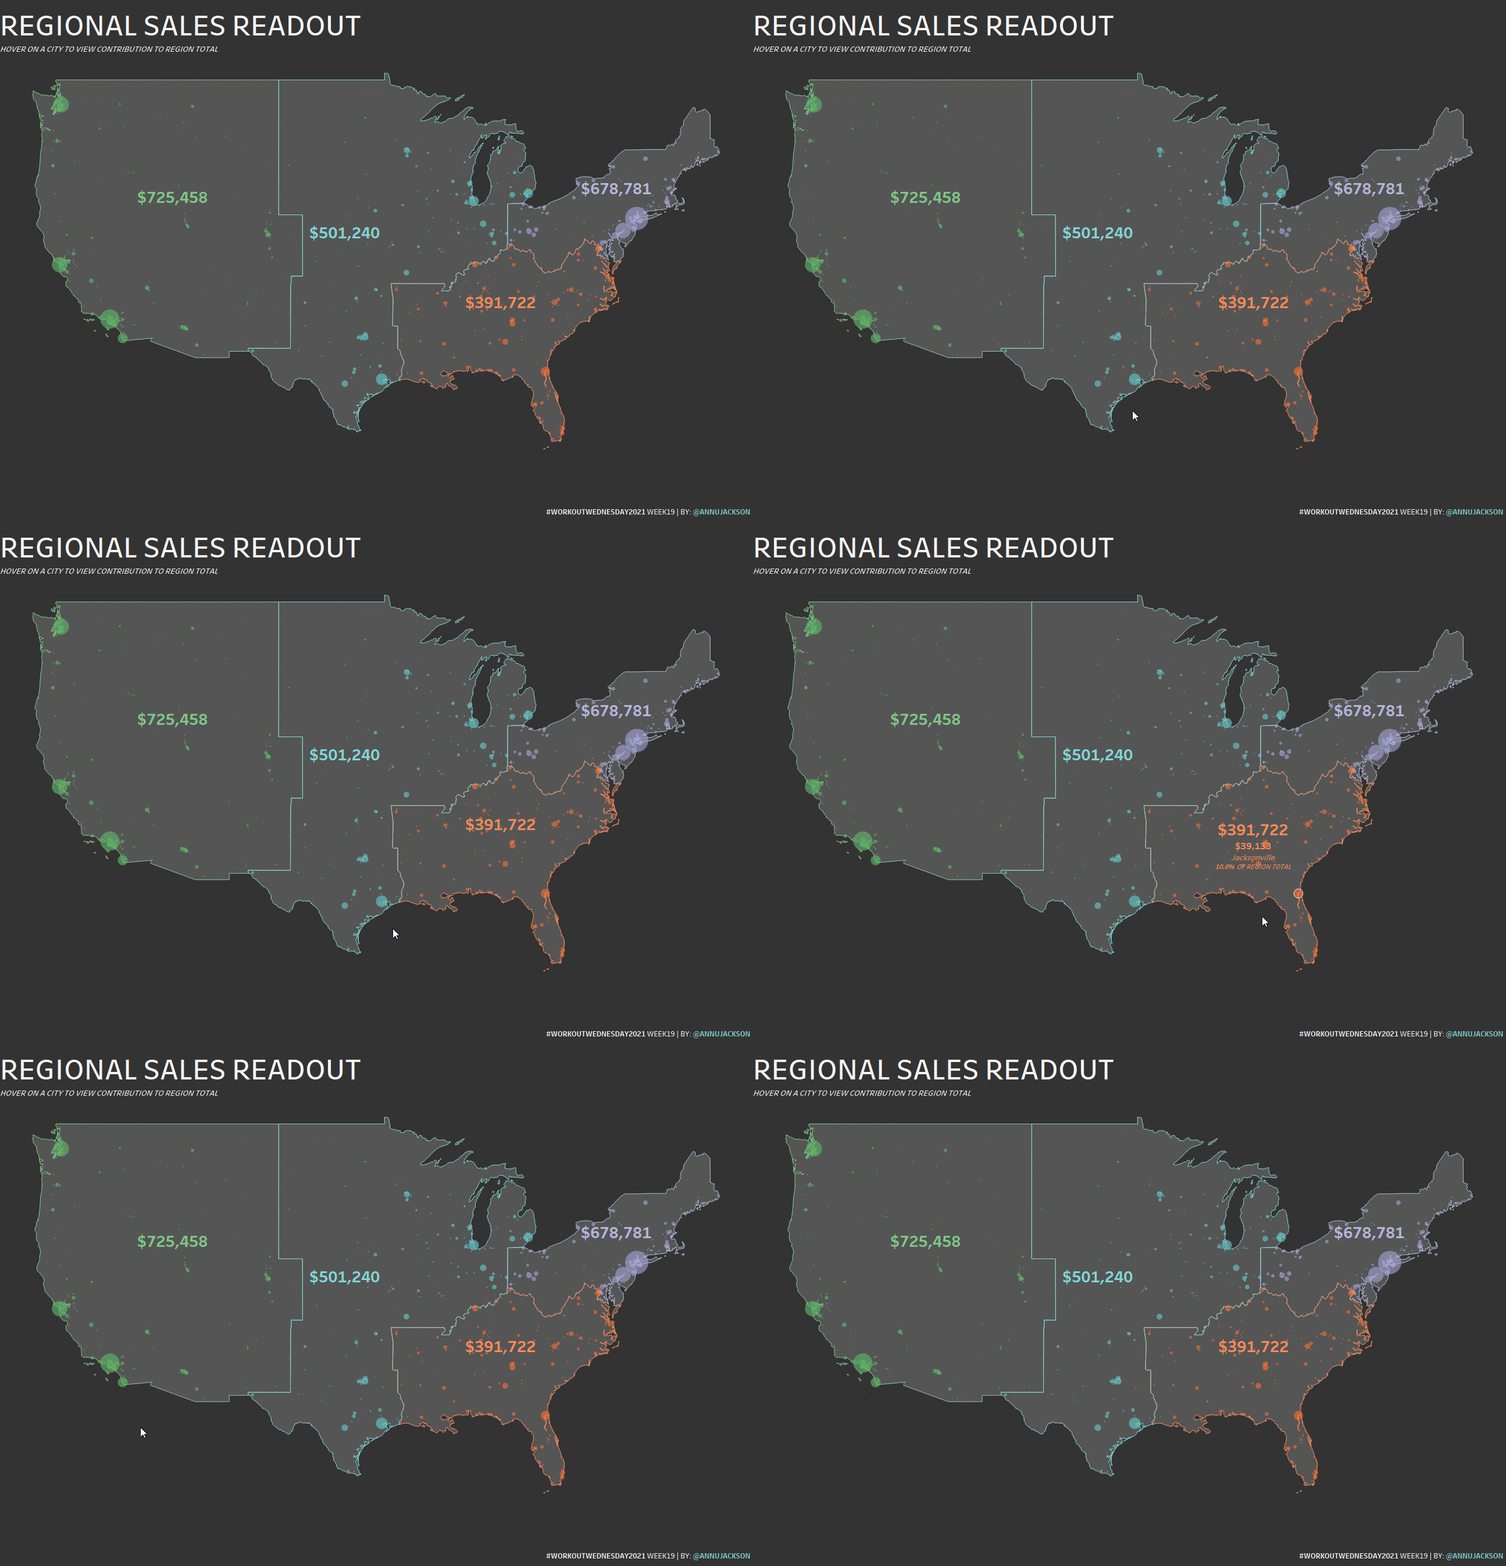
You’re tasked with recreating a Regional Readout Report where Sales teams can see the performance of various cities within their Region. They’ll be able to get more information by hovering over a city.
The best part about this challenge? You’re not allowed to use Table Calculations or LODs. You’ll have to use all your other Tableau knowledge to construct the solution. And before you ask, I’m also limiting you to one worksheet.
Requirements
- Dashboard Size: 1300px by 900 px
- # of Sheets – 1
- Create a Map showing the total sales for each region
- Add functionality so that when you hover over a city, it shows the total sales for that city in the map with the % of total for the region, the name of the city, and the city’s sales amount
- Make the border for each region a different color
- No tooltips this week, it’s all about hover interactivity
- You’re not allowed to use Table Calculations or Level of Detail (LOD) expressions
- You are allowed to use floating text boxes
This does require Map Layer functionality, so you’ll need at least Tableau 2020.4.
If you’re viewing the solution on Tableau Public, go easy on hovering it tends to be delayed.
Dataset
This week uses the superstore dataset packed with 2021.1. You can get it (or a similar version) here at data.world
Attribute
When you publish your solution on Tableau Public make sure to take the time and include a link to the original inspiration. Also include the hashtag #WOW2021 in your description to make it searchable!

Share
After you finish your workout, share on Twitter using the hashtag #WOW2021 and tag @AnnUJackson, @ItsCandraM, @LukeStanke, @_Lorna_Brown and @HipsterVizNinja


