Calendar years run from January 1st until December 31st, but an organization’s fiscal year might start in a different month. In this week’s challenge, a company’s fiscal year runs from October 1st through September 31st. Let’s see how this company performs. Configure your workbook as follows:
Set the default fiscal year to start on October 1st.
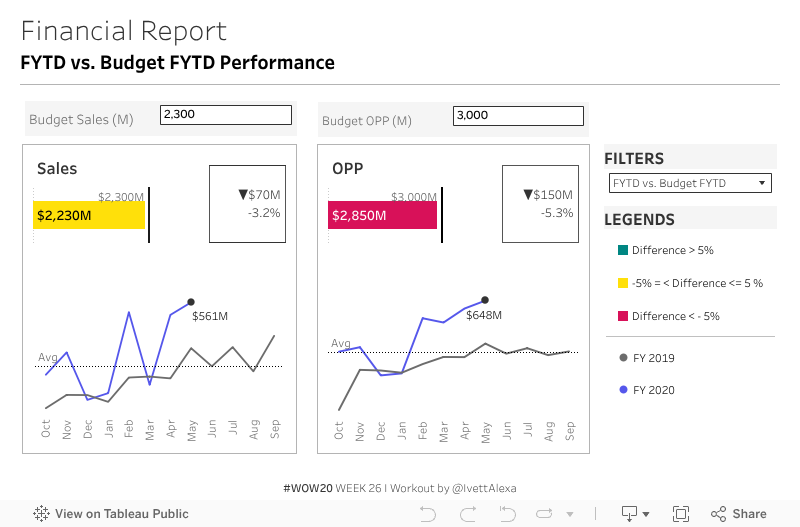
Build a dashboard that shows the Sales and OPP values.
Sales: Account Number starts with 5
OPP: Account Number starts with 5 and 696
Create a horizontal bar chart – for Sales and OPP value – that shows the Current FYTD Period and the line that represents the Prior FYTD Period/Budget based on a Parameter Selection.
Show the exact differences and % differences between the Current and Prior Period/Budget as KPIs.
The color of the Current Period is based on the % difference. If the Revenue is less than Budget then it is a Red.
Difference > 5% | # 008682 – Green
-5% = < Difference <= 5 % | # FFE00A – Yellow
Difference < – 5% | # D81159 – Red
Allow the user to set the Budget of Sales and OPP in million. Show these parameter boxes only when the FYTD vs. Budget FYTD is selected.
Create a line chart – for Sales and OPP value – that shows the Current and Prior Monthly Period.
FY 2019 #6C6C6C – Dark Grey
FY 2020 #5557EB – Purple
Dataset
Data from this week is prepped by me. You can download it here at data.world
Attribute
When you publish your solution on Tableau Public make sure to take the time and include a link to the original inspiration. Also include the hashtag #WOW2020 in your description to make it searchable!