
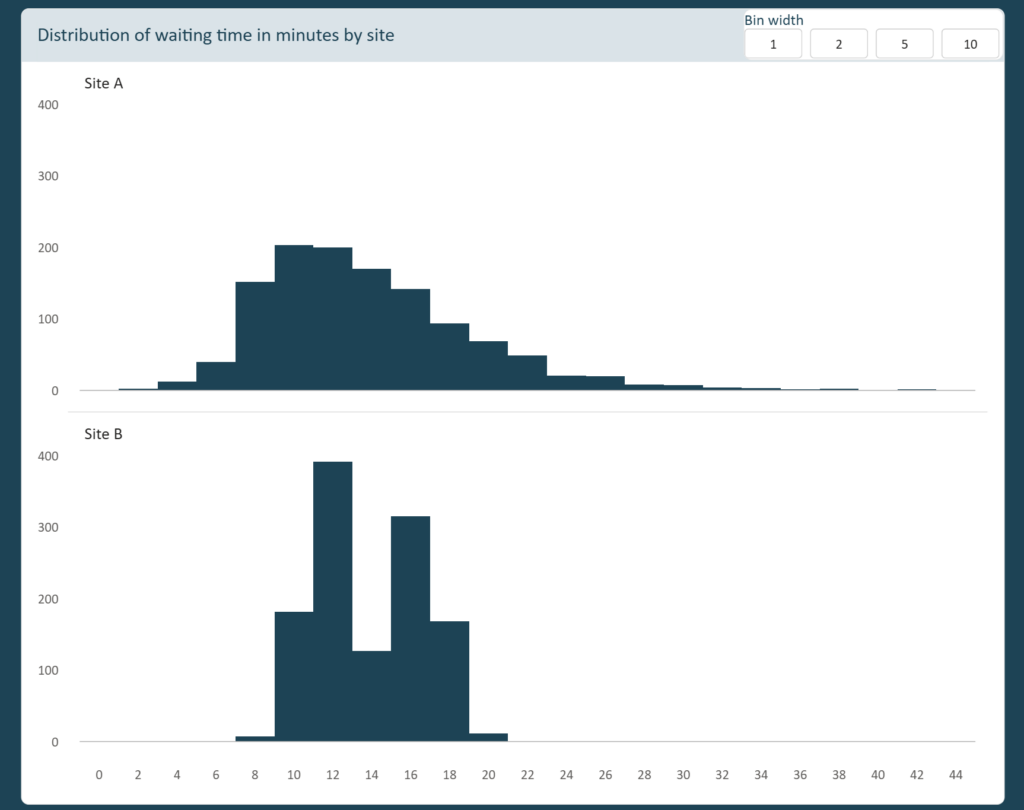
2026 Week 39 | Power BI: Histograms with adjustable bin width
Introduction Two sites of the same walk-in clinic report the same average wait: 14.8 minutes at Site A, 14.8 minutes at Site B. On a KPI card they are twins, and there is nothing to discuss. Then you look at the 2,400 individual waits. Site A runs mostly quick, with a tail that drags out […]
2026 Week 39 | Power BI: Histograms with adjustable bin width Read More »
Power BI, Workout Wednesday