Introduction
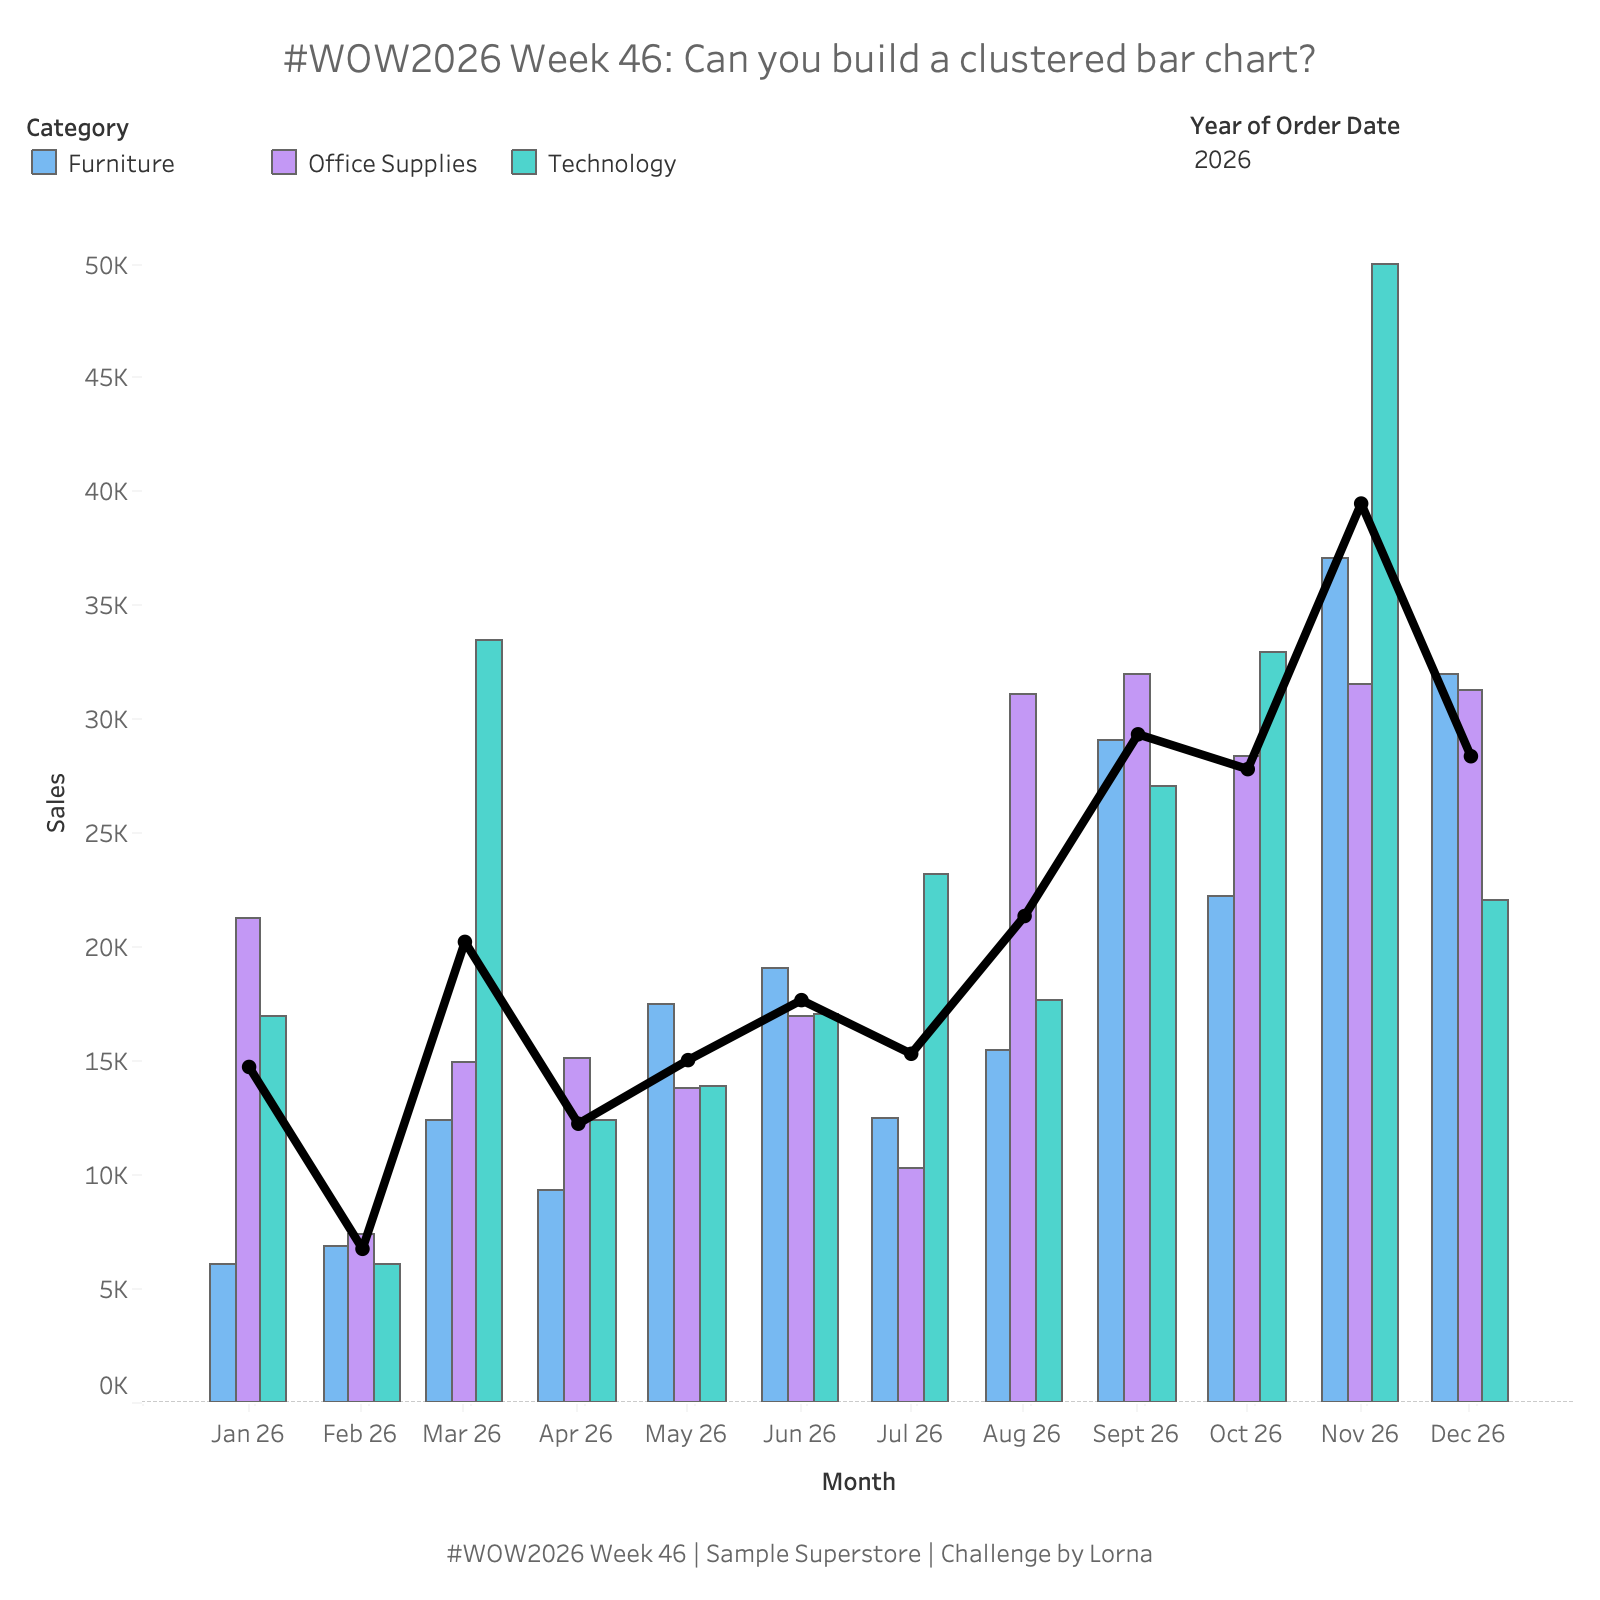
Tableau doesn’t have a native clustered bar chart, so this week’s challenge is all about getting bars side by side where you want them. Can you cluster Sales by Category for each month, then layer a line over the top to show how each month compares with the average? It’s a good test of continuous dates, dual axes and a bit of calculation creativity.
Requirements
- Dashboard size: 800 x 800px
- Use Sample Superstore
- Show monthly Sales as a clustered bar chart, with Furniture, Office Supplies and Technology side by side for each month (not stacked)
- The x-axis should be a continuous date axis, formatted “mmm yy” and titled “Month”
- Order the bars in each cluster: Furniture, Office Supplies, Technology
- Add a black line with markers showing the average monthly Sales across the three Categories
- Position the line markers in the centre of each cluster, in line with the Office Supplies bars
- Colour the bars by Category, with a horizontal legend at the top of the dashboard
- Add a Year filter (multi-select dropdown) at the top right, defaulting to 2026
Dataset
Sample Superstore
Available from here.
Attribute
When you publish your solution on Tableau Public make sure to take the time and include a link to the original inspiration. Also include the hashtag #WOW2026 in your description to make it searchable!

Share
After you finish your workout, share on Twitter and/or LinkedIn using the hashtag #WOW2026 #Tableau and tag @WorkoutWednsday