Introduction
We recently wrapped up a Survey for the Workout Wednesday community gauged at understanding what YOU are interested and what areas of opportunity our team may have.
During our latest group meeting I was struck with the idea that this was the perfect opportunity to get a twofer – practice visualizing survey data AND to have the community analyze and draw their own conclusions about WOW.
On that note, I present this week’s challenge. You’ll be using Tableau to visualize the responses of our 63 participants. I have intentionally pared down all the questions to focus on the number one skill you guys mentioned interest in: Table Calculations.
For the sake of the challenge, you’re not allowed to use LODs (even though that is very tempting). You must only use Table Calculations and normal calculated fields. You are allowed to add on any additional visualizations for questions or change up how you would visualize – have fun with our data!
Requirements
- Dashboard Size: 1400px by 1800px
- # of Sheets – up to you
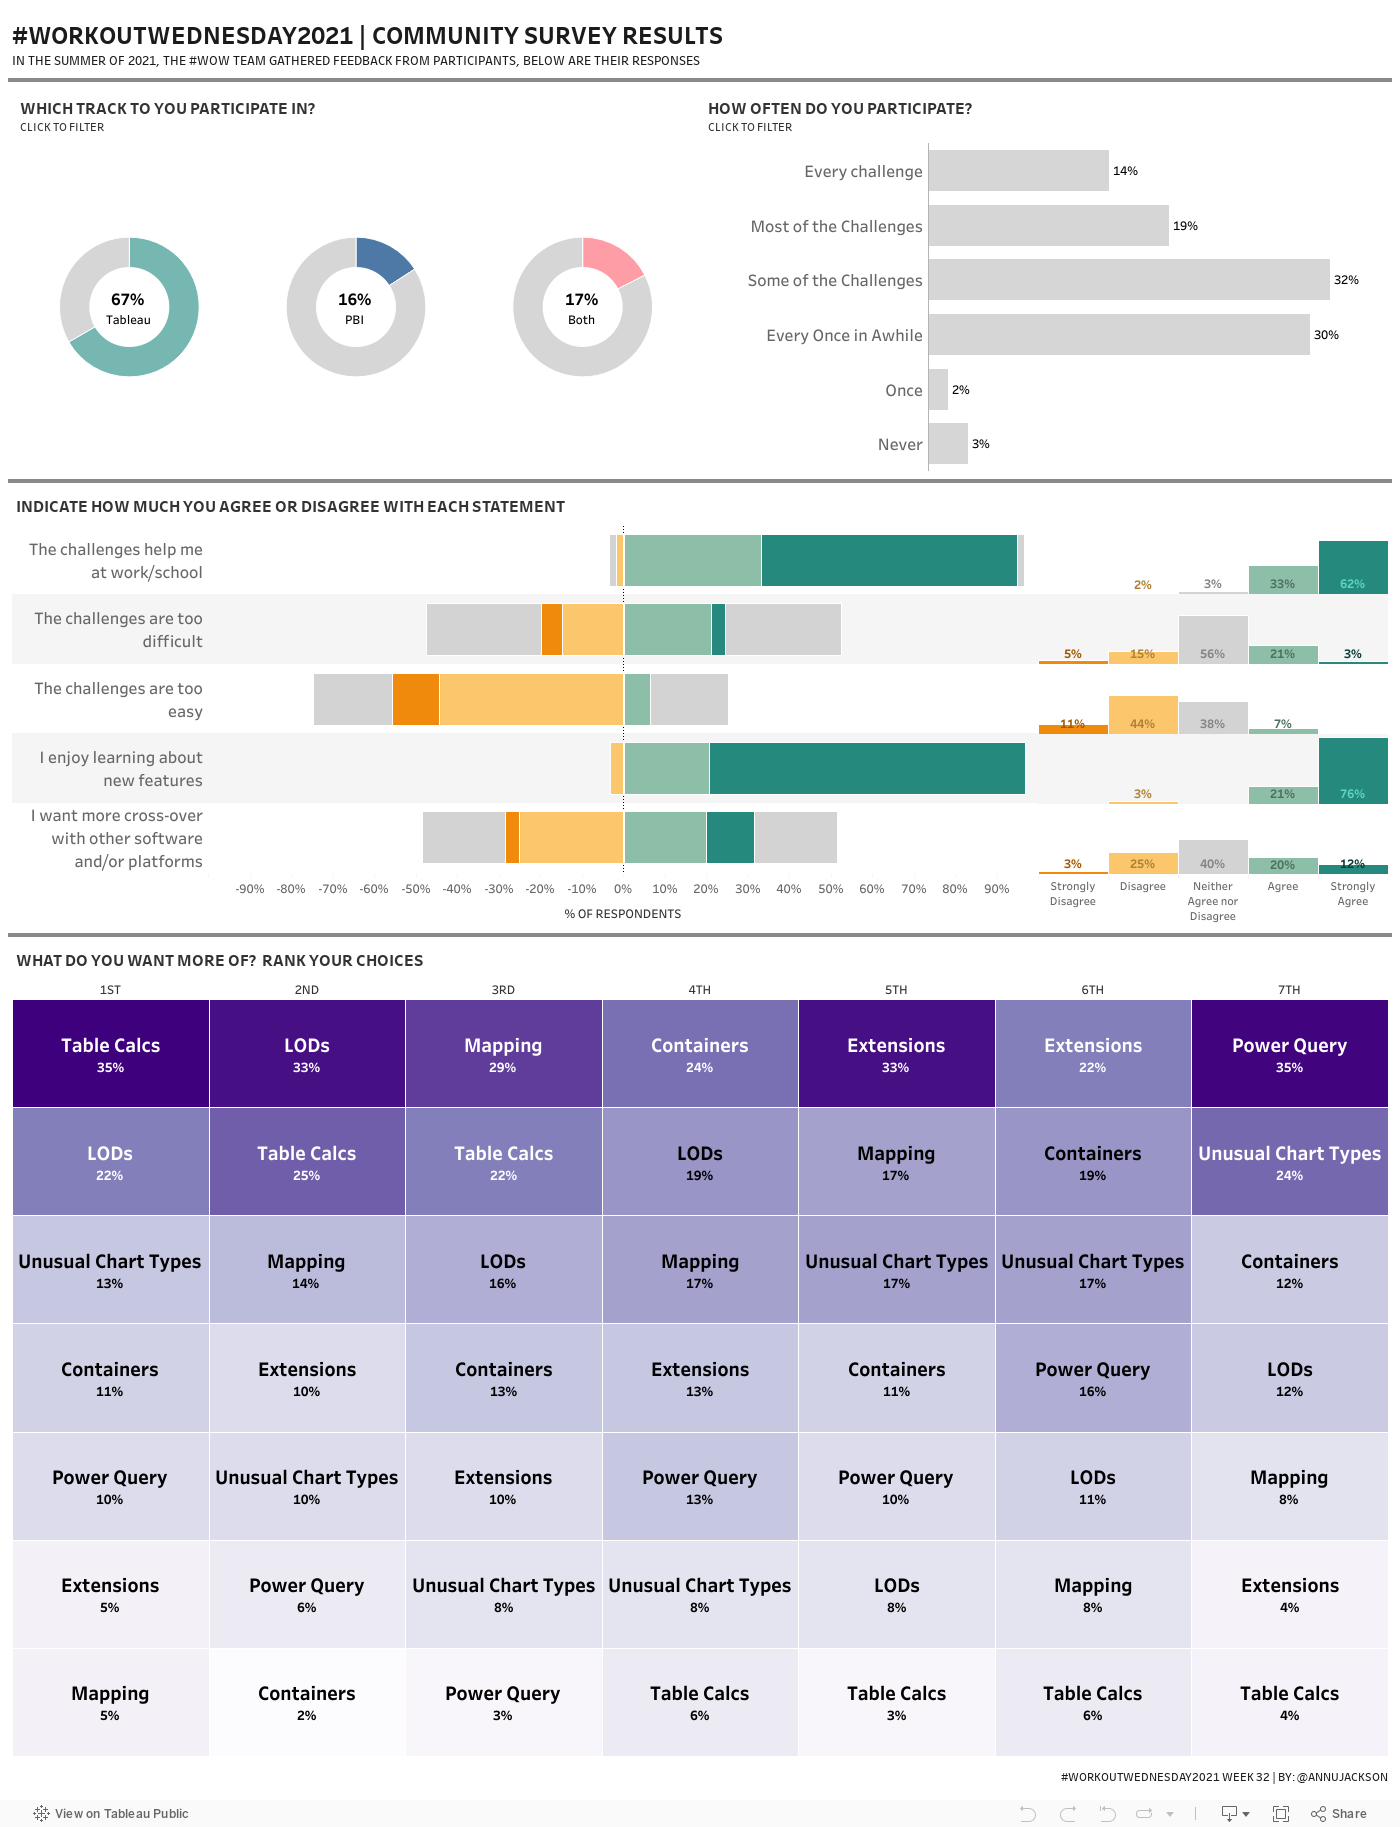
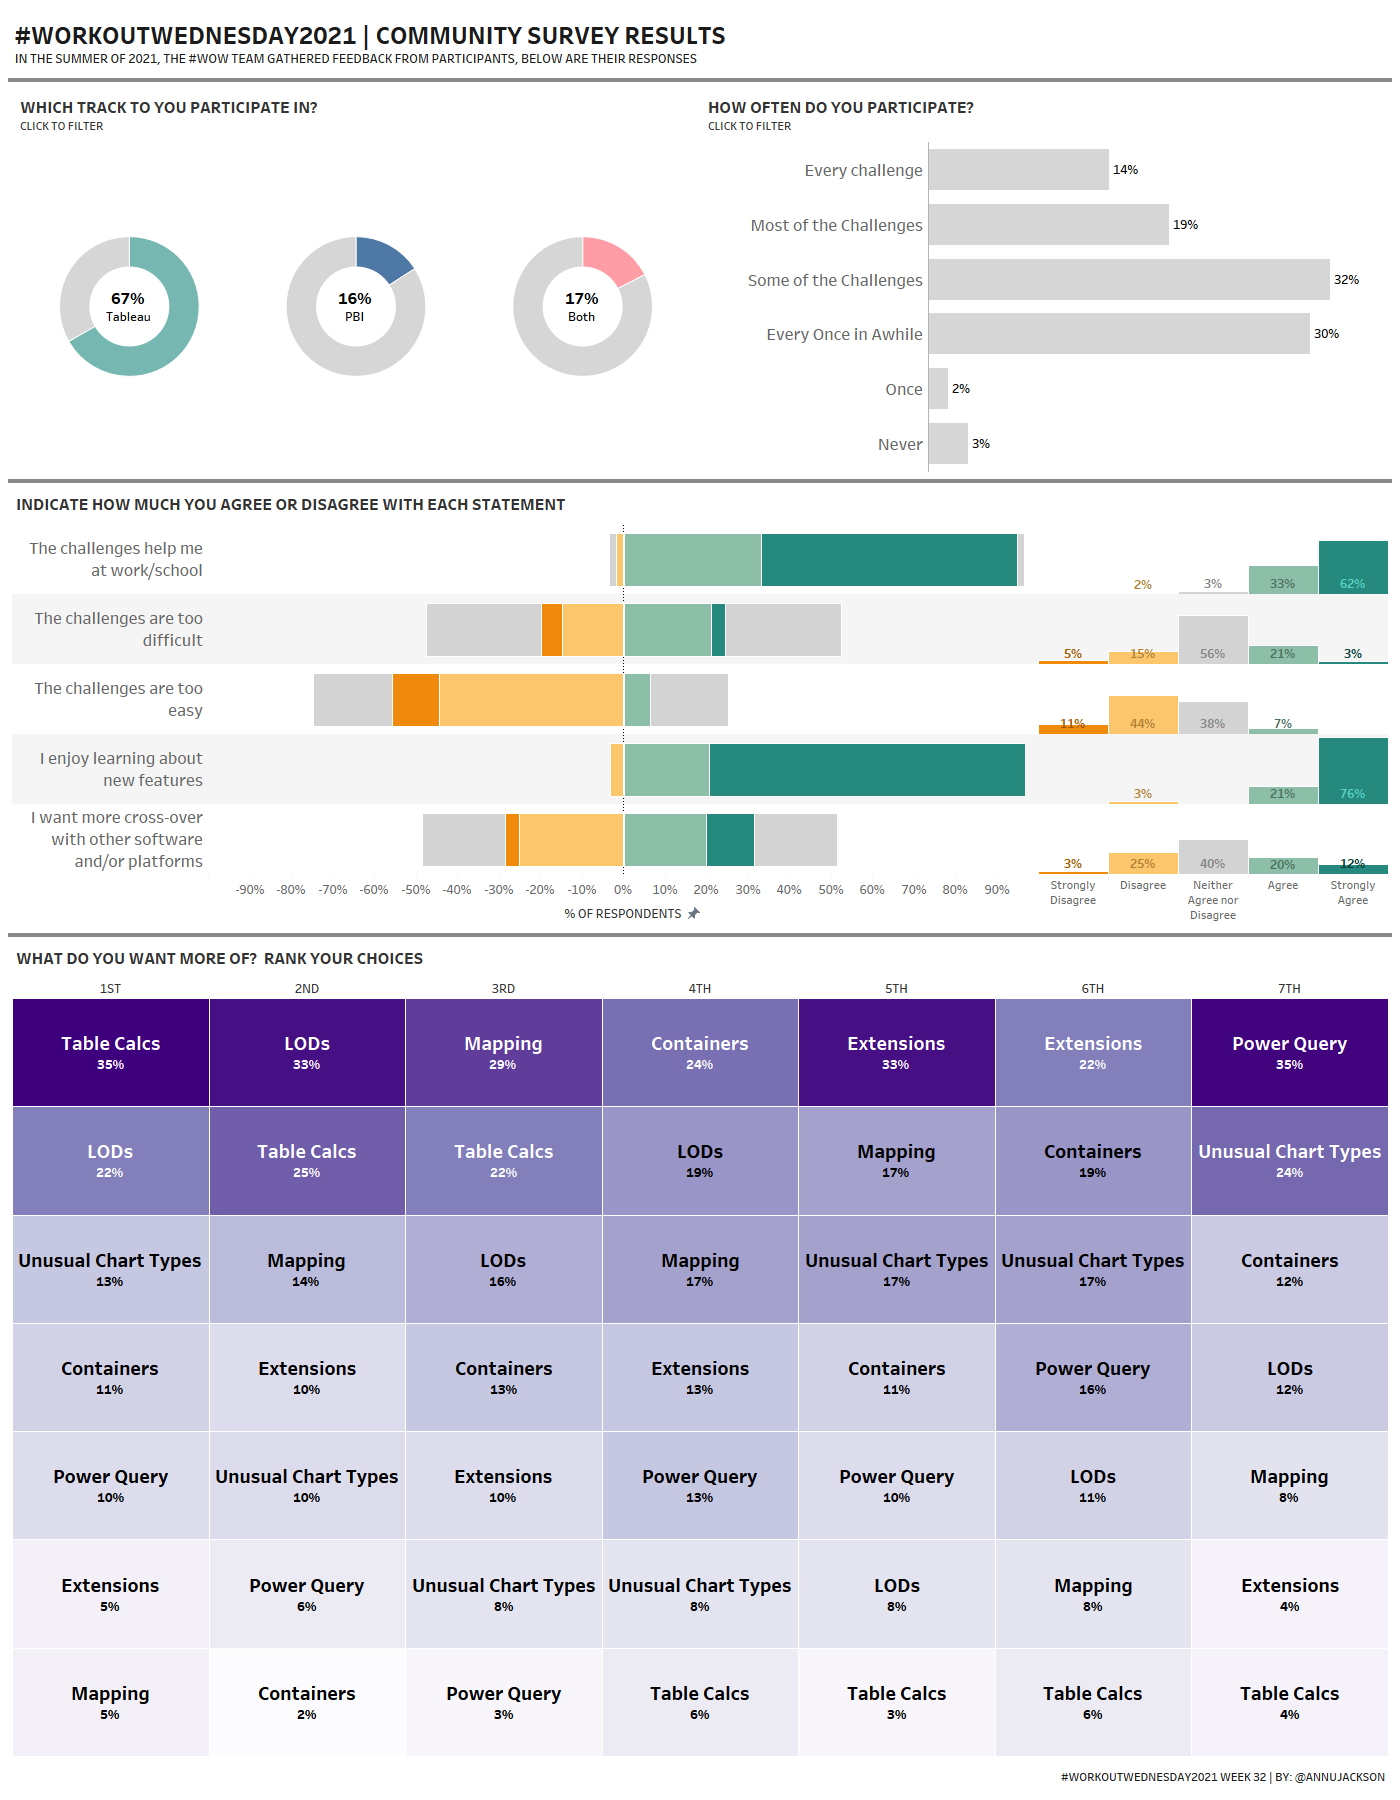
- Create donut charts that show % of participants for each tool, make them interactive filters
- Create a bar chart showing participation frequency that is also an interactive filter
- Build divergent bar charts paired with vertical bar charts to express how much respondents agree/disagree with 5 questions.
- Build a grid (heatmap/highlight table) showing the rank and percentage of each of the categories by rank order (hint here: I aliased the Questions to have the rank title)
- Formatting
- Match all tooltips and dashboard dividers
- Green-Orange-Teal for divergent bar chart combo
- Purple continuous color palette is from Color Brewer set, if you don’t have it, choose one you like!
Dataset
This week uses our survey data. I’ve done some light data cleaning and reshaping, you can download the CSV file from Google Drive.
Attribute
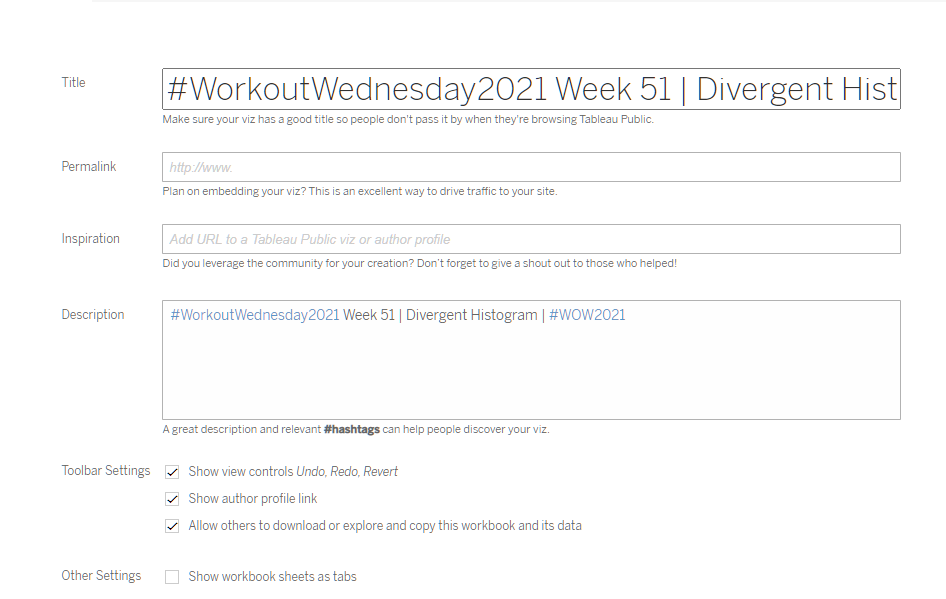
When you publish your solution on Tableau Public make sure to take the time and include a link to the original inspiration. Also include the hashtag #WOW2021 in your description to make it searchable!
Share
After you finish your workout, share on Twitter using the hashtag #WOW2021 and tag @AnnUJackson, @ItsCandraM, @LukeStanke, @_Lorna_Brown and @HipsterVizNinja
Solution
Interactive