Introduction
This weeks community challenge is by Donna Coles.
When I was approached by the #WOW crew to provide a guest challenge, I was a little unsure as to what I could do. I primarily work as a Tableau Server admin, so rarely have a need to build dashboards (which is why I like to do the weekly #WOW challenges, to keep up my Desktop skills). Then the next day I was looking at a dashboard I’d built to monitor extracts on our Tableau Servers, and I thought it would be an ideal candidate for a challenge. I also thought it would provide any users of Tableau Server with the opportunity to implement this dashboard in their own organisation if they wished, by sharing with their Server Admins.
The data is primarily based on information out of the background_tasks table in Tableau’s
PostgreSQL repository. The data for this challenge provides 1 row for each extract task that was created between Monday 11th Jan 2021 and Friday 5th Feb 2021. The key fields of note are:
- Id – uniquely identifies a task
- Created At – when the task was created
- Started At – when the task actually started running (if too many tasks are set to run at the
same time, they will queue until the server resources are available to execute them). - Completed At – when the task finished, will be NULL if task hasn’t finished.
- Finish Code – indicates the completion status of the job (0=success, 1=failed, 2= cancelled)
- Progress – supposed to define the % complete, but has been observed to only ever contain 0
or 100, where 100 is complete. - Title – the name of the extract (could be a published data source or a workbook)
- Site – the name of the site on the server the extract is associated to
Requirements
- Dashboard size 1000 x 800
- 2 sheets
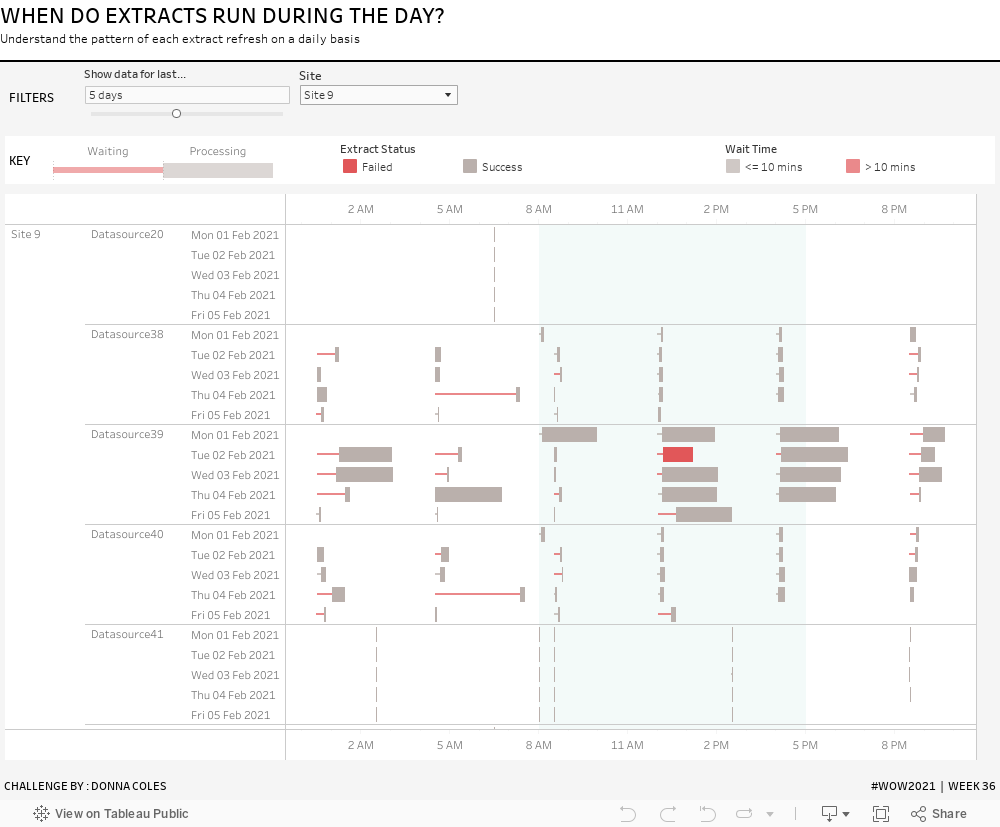
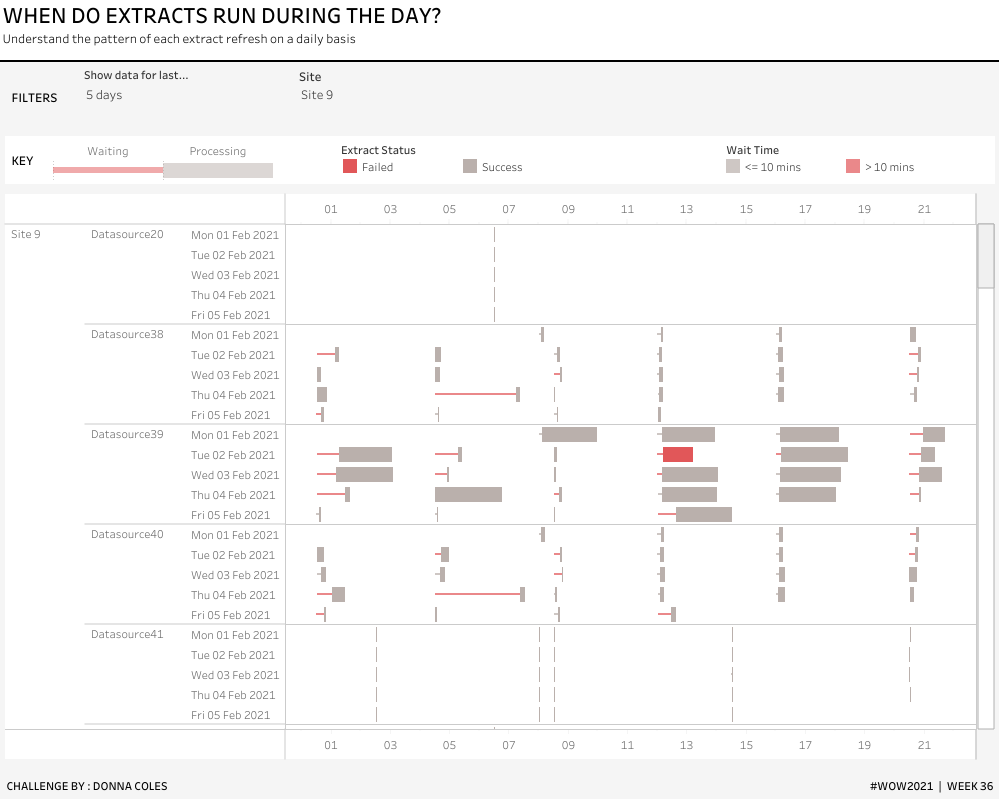
- Create a chart that shows when tasks run over a 24hr period, and for how long they had to
wait (thin bars) and how long they took to process (thicker bars). - The processing bars should be coloured based on the status of the extract task as defined
below. - The waiting bars should be coloured based on whether the task had to wait over 10 minutes
or not. - For the purposes of this task, assume the dashboard is being looked at on 05 Feb 2021 at
16:30. - Indicate ‘core working hours’ on the chart of 8am – 5pm via a coloured band.
- Allow the data to be viewed for last 1-10 days.
- Add a key to describe how the bars should be read (up to you how you choose to implement
this). - Match tooltips & formatting (note the tooltips on the bars do differ slightly)
Extract Status:
Based on the Finish Code and Progress fields, I have derived a calculated field to determine the state of the extract (to be honest, I think this is a definition I have inherited from closer analysis of the Background Tasks for Extracts Server Admin view, so am trusting Tableau with the logic).
IF [Finish Code] = 1 AND [Progress] <> 100 THEN ‘In Progress’ ELSEIF [Finish Code] = 0 AND NOT [Progress] = 1 THEN ‘Success’
ELSE ‘Failed’
END
Dataset
This week uses anonymised data provided by Donna, and is using TS_Background_Tasks. It can be found here
Attribute
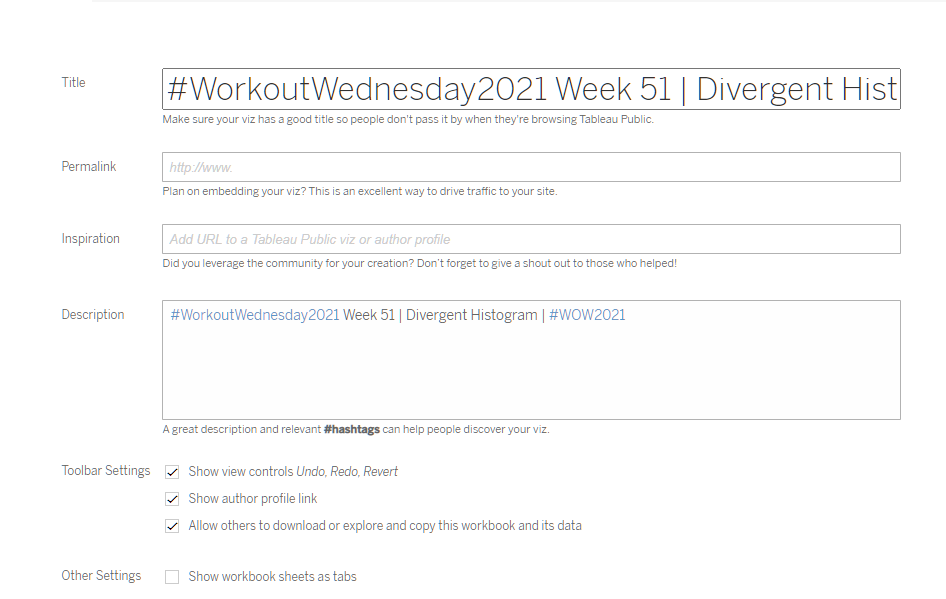
When you publish your solution on Tableau Public make sure to take the time and include a link to the original inspiration. Also include the hashtag #WOW2021 in your description to make it searchable!
Share
After you finish your workout, share on Twitter using the hashtag #WOW2021 and tag @DonnaColes30, @AnnUJackson, @ItsCandraM, @LukeStanke, @_Lorna_Brown and @HipsterVizNinja
Solution
See Donna’s solution guide https://donnacoles.home.blog/2021/09/12/when-do-extracts-run-during-the-day/ for help on this week’s challenge.
Interactive