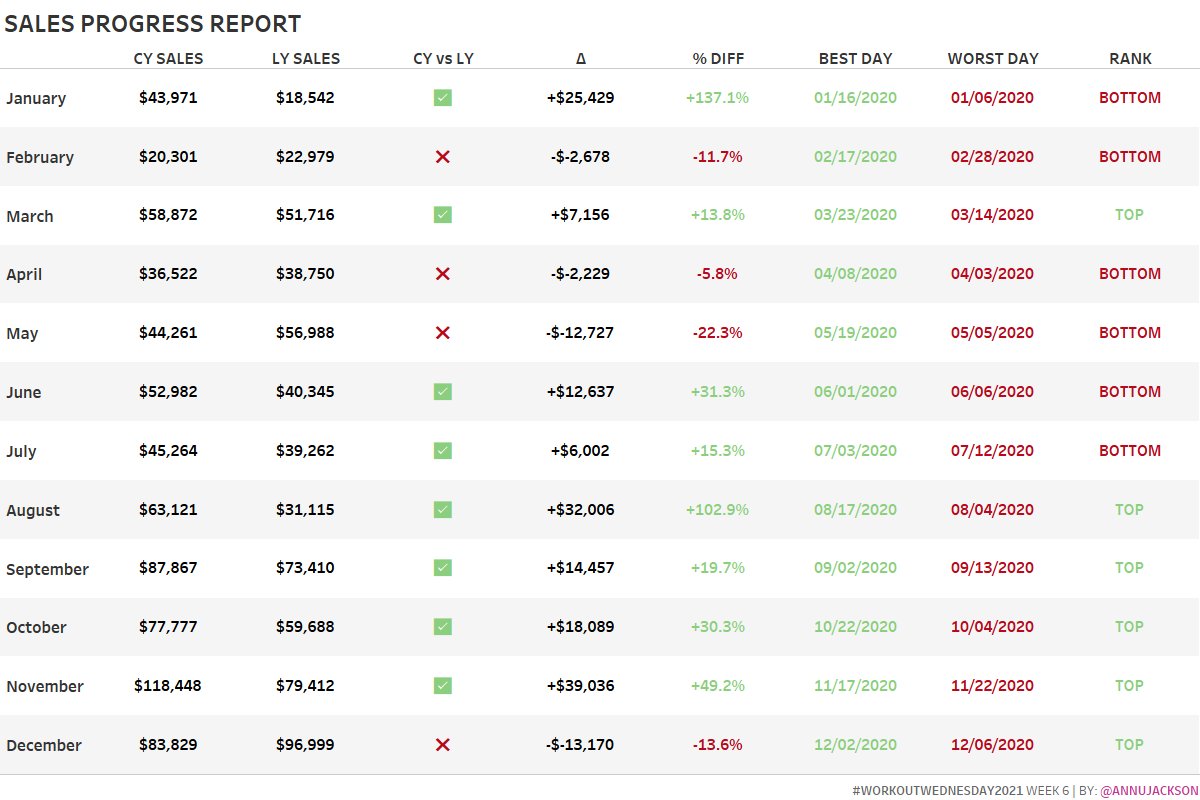
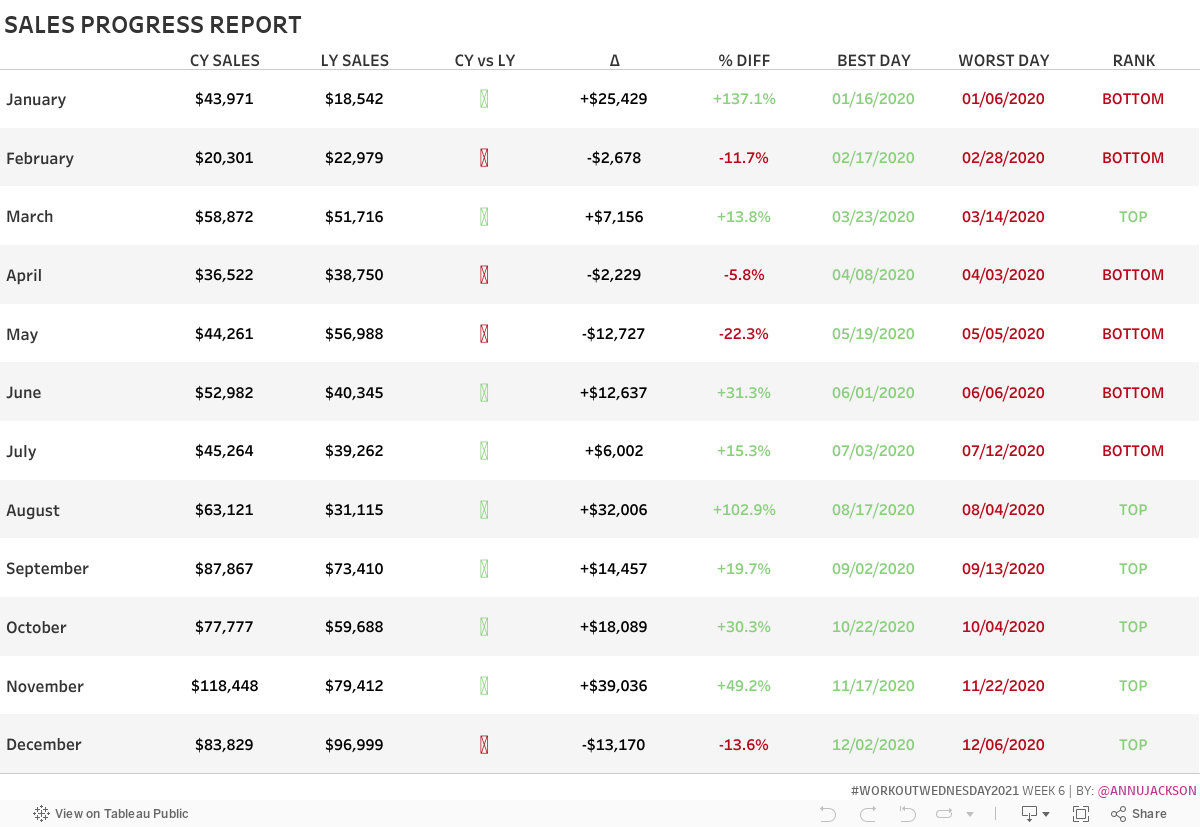
This month I’ve decided to focus on something you’ve rarely ever seen from me – a good old fashioned text table. This challenge should be straightforward for users of all levels.
And of course since I try to avoid plain text tables, this one has some fancy formatting thrown in for good measure.
There is one major criteria for this week – you may only use Measure Names and Measure Values.
CY Sales (you can hardcode as 2020 or create an LOD)
LY Sales (2019)
% Diff Sales
Delta Sales
CY vs LY result – check mark if CY > LY otherwise X
Best sales date per month
Worst sales date per month
Formatting – red and green are from Traffic Light palette
A small hint: dates are numbers too!
Dataset
This week uses the superstore dataset for Tableau 2020.4. You can get it here at data.world
Attribute
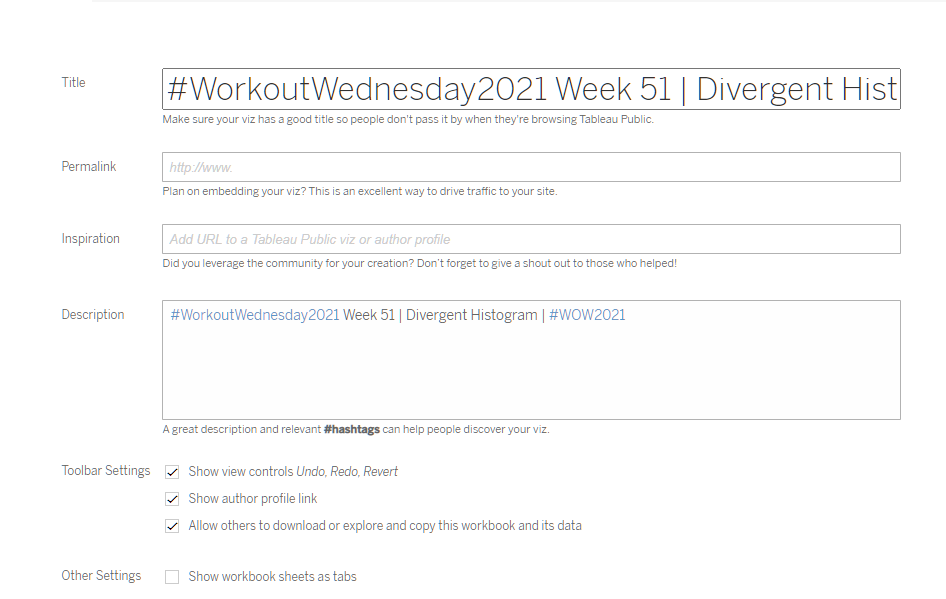
When you publish your solution on Tableau Public make sure to take the time and include a link to the original inspiration. Also include the hashtag #WOW2021 in your description to make it searchable!