
Introduction
I’m not going to hide it: this week will be hard. But this challenge is inspired by real events. In the four months I’ve helped solve various versions of this same problem: how do you do nest a table calculation inside of a level-of-detail calculation? You don’t. But you can nest table calculations–which is your challenge this week.
This week requires you to think through a challenge with 3 different levels of detail. First you must calculate if a customer re-orders within 90 days of the previous order. Next you need to figure out the percentage of reorders by customer. Finally you’ll need to figure out the overall reorder rate.
Difficulty: 10/10
Requirements
- Dashboard Size: 600px by 800 px
- 2 sheets (1 for KPIs and 1 for the table + timeline)
- Table
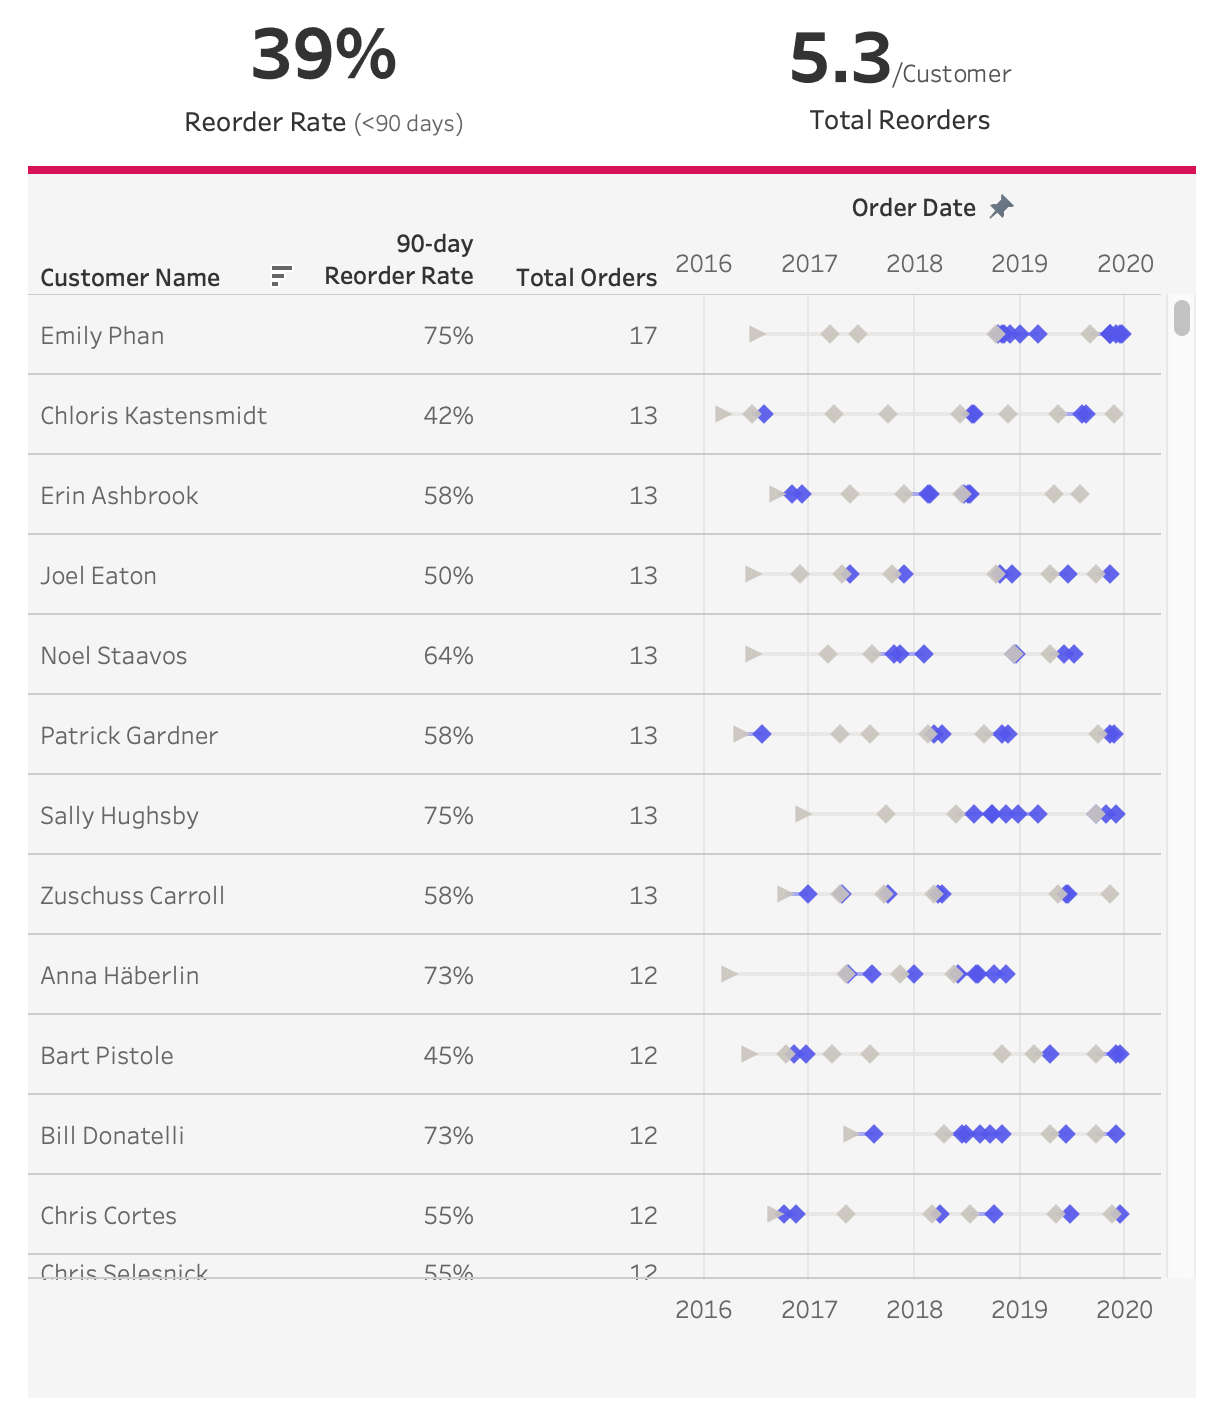
- The table should breakdown orders by [Customer Name]. The table should be sorted descending by total orders descending.
- Include a column for 90-day reorder rate. This would be the percent of orders that have occurred within 90 days of the previous order by that customer. The first order of any customer should not be included in the metric.
- Add an additional column for total orders by the customer.
- Include horizontal dividers for each row.
- On the dashboard, add a 4 pixel red header (#D81159) to the table–this is repeat practice from Week 1 of this year.
- Timeline
- Determine if a customer has made a reorder or not. If it is the first order then add a right-pointing arrow mark. If it is a reorder set the mark type to diamond.
- Calculate if an order by a customer is less than or equal to 90 days of the previous order of a customer. If its within 90 days then set the mark type to purple (#5557EB) if it’s greater than 90 days set the color to gray (#CAC4BE).
- Add a “line” that connects each of the marks. Make sure the “line” color matches with the following mark. It must be a single color.
- Match the tooltips. When the orders are within 90 days make sure the label is colored purple.
- KPIs
- Create a KPI for the overall 90 day reorder rate. This should only reorders (not first orders by a customer. You may only show text on a single mark. Match formatting of the additional text on the KPI.
- Add as second KPI that shows the average re-orders per customer. Use [Customer Name] and not [Customer ID] (if your data has this). Match formatting of the additional text on the KPI.
- Make sure no lines or borders are included are included in the KPIs.
- EXTRA CHALLENGE: Be sure to put no values on the filters card.
- Match all formatting
Dataset
This week uses the superstore dataset for Tableau 2019.4. You can get it here at data.world
Attribute
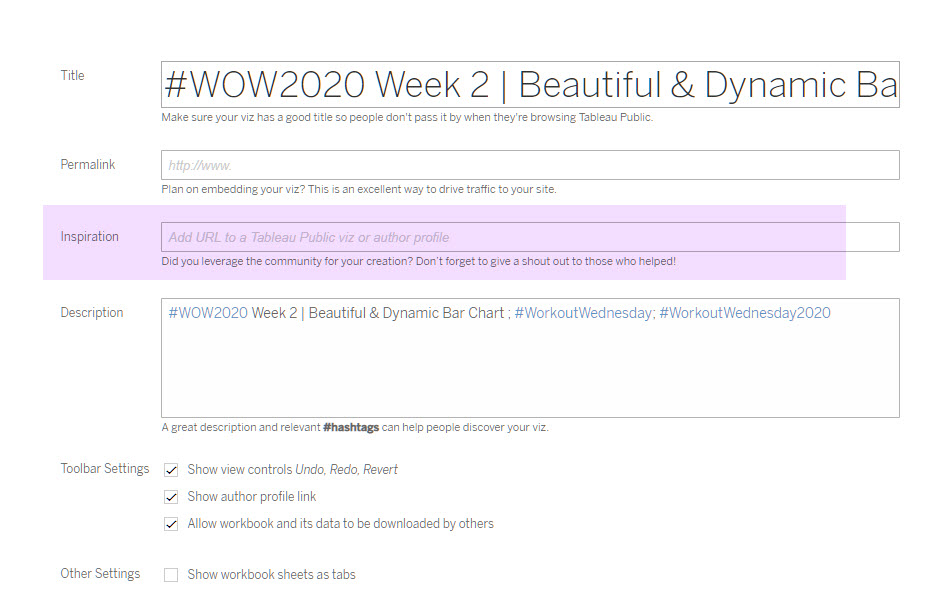
When you publish your solution on Tableau Public make sure to take the time and include a link to the original inspiration. Also include the hashtag #WOW2020 in your description to make it searchable!
Share
After you finish your workout, share on Twitter using the hashtag #WOW2020 and tag @AnnUJackson, @LukeStanke, @lorna_eden, and @HipsterVizNinja
Solution
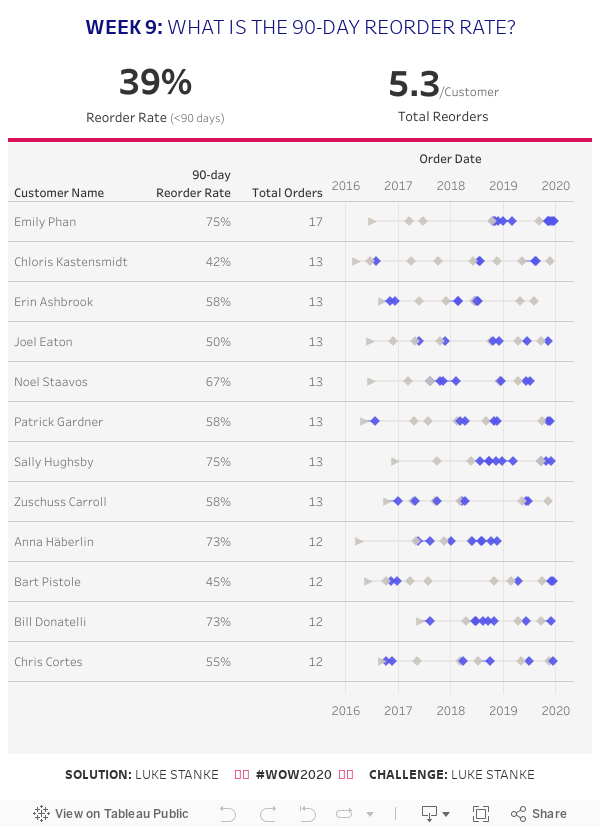
hi luke,
this was though!
(but i had more issues with BANs than with the timeline)
Here’s my shot:http://bit.ly/WoW2020w09