
August Community Submission Month
Welcome to community submission month. For all 5 of those weeks we’ll have our favorite community submissions as challenges. FYI: You can still submit here.
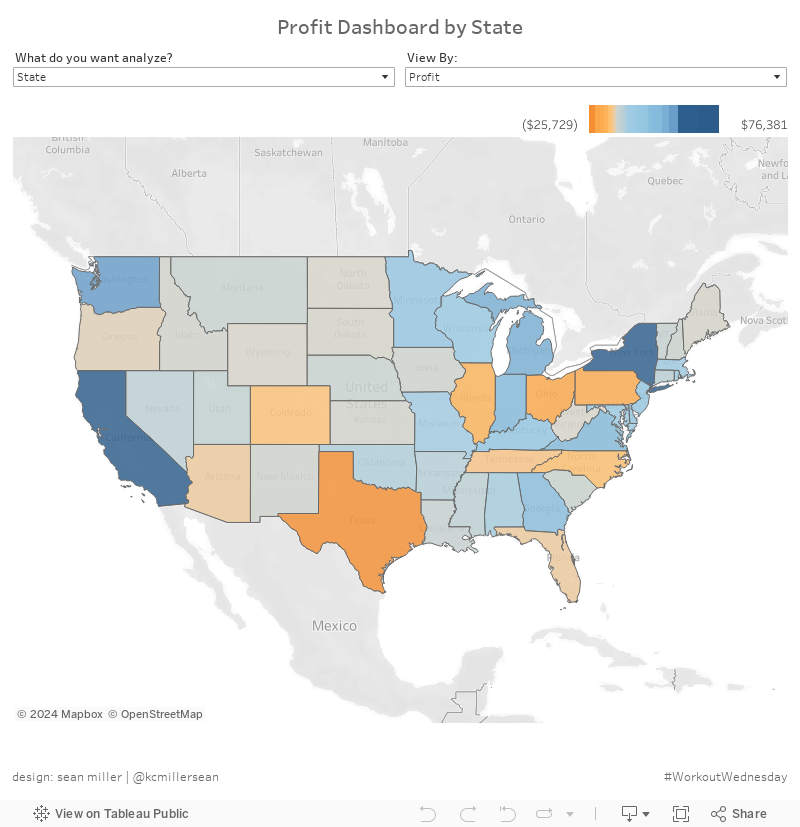
Community Submission Challenge #1: Sean Miller
Our first community challenge comes from Sean Miller. Sean is located in Kansas City, Missouri in the United States. He’s worked at Cerner – a large healthcare company – in data visualization for nearly the past five years. He’s also very involved in the Tableau Twitter community. Don’t forget to follow him on twitter. With that, here is Sean:
How to Show/Hide a dynamic color legend
This week we’re digging into Tableau’s color legend. In a recent project at work, I was presented with this same challenge. This was a small piece of a much larger dashboard.
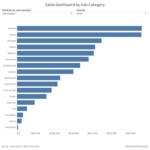
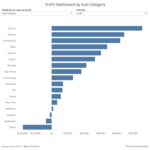
The client had a requirement that they wanted to be able to flex between different dimensions and different measures depending on the analytic. Among others were simple bar chart and a chloropleth map (Original challenge was down to the zip code).
Additionally, the client only wanted color variation on the map. This presented a challenge because best practice tells us that when there is color variation we must have a legend but Tableau legends do not flex dynamically.
Your challenge this week is to replicate the standard color legend so that it flexes along with the selections made in the parameters.

Requirements
- Dashboard size: 800 x 800. Total sheets are part of the challenge.
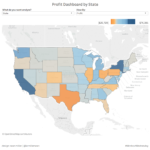
- Allow users to select between sales and profit as the measure.
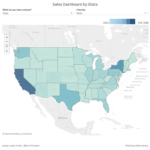
- The map should have the corresponding measure on color.
- When the map is active, the color legend and min/max values should show. When subcategory is active the legend and values show be hidden.
- The color legend should be a stacked bar.
- The title should update appropriately.
Dataset
This week uses the superstore dataset for Tableau 2018.1. You can get it here at data.world
Share
After you finish your workout, share on Twitter using the hashtag #WorkoutWednesday and tag @AnnUJackson, @LukeStanke, @RodyZakovich, and our community contributor @kcmillersean. (Tag @VizWizBI too – he would REALLY love to see your work!)
Track your progress
Also, don’t forget to track your progress using this Workout Wednesday form.
#SPOILERS
- Tableau sorts differently depending on chart type.
And week 31 is DONE!
https://public.tableau.com/profile/marcodegola#!/vizhome/WorkoutWednesday2018-Part2/2018w31-ww?publish=yes
STUFF LEARNED: parmater graph switch – SUPER USEFUL
TNX!