
Introduction
If you weren’t aware, June was Music Month and Kerry Kolosko gave us a brilliant visualization of Beatles tunes using Charticulator – you can check out the challenge here.
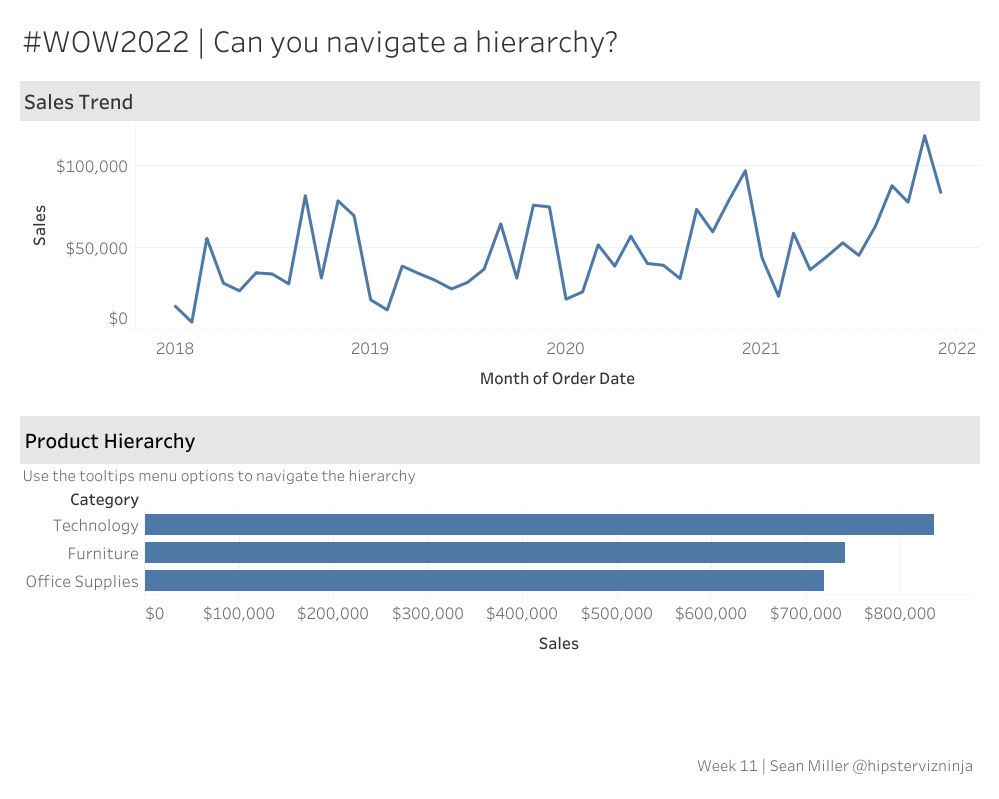
This week we are going to be recreating a recent Tableau challenge from Sean Miller that was featured in Week 11 of this year’s Tableau challenges. You can find the screenshot of the dashboard below and a link to the challenge here.
You can find my interpretation of the Tableau Week 11 challenge below.
Requirements
- Create your data model using the Superstore data
- Create a line chart showing the Sales trend by Month and Year
- Create a bar chart that has the Category, Sub-Category, and Product Name as the three levels of hierarchy within the Rows
- Enable Drill Down in the bar chart visual
- Ensure in Edit Interactions that clicking down on the bottom bar chart now only drills down but it also filters the trend line above
- That’s all! I know there were quite a few more steps required to complete the Tableau version, but that’s all you need to do!
Dataset
This challenge uses the Tableau SuperStore dataset provided on data.world. You will need to log in to data.world to retrieve the data, but accounts are free.
Share
After you finish your workout, share on Twitter using the hashtags #WOW2022 and #PowerBI, and tag @JSBaucke, @MMarie, @shan_gsd, @KerryKolosko, and @NerdyWithData. Also make sure to fill out the Submission Tracker so that we can count you as a participant this week in order to track our participation throughout the year.
The video link takes me to the Week 20 Pie Matrix solution video. Is there a solution video available for this challenge? Thanks!
Hiya, the solution video link points to wrong challenge. 🙁
Thank you Desiree! We’ll get that fixed ASAP! cc: @Spencer Baucke