2021 Week 31: Can You Find the Needle in the Haystack?
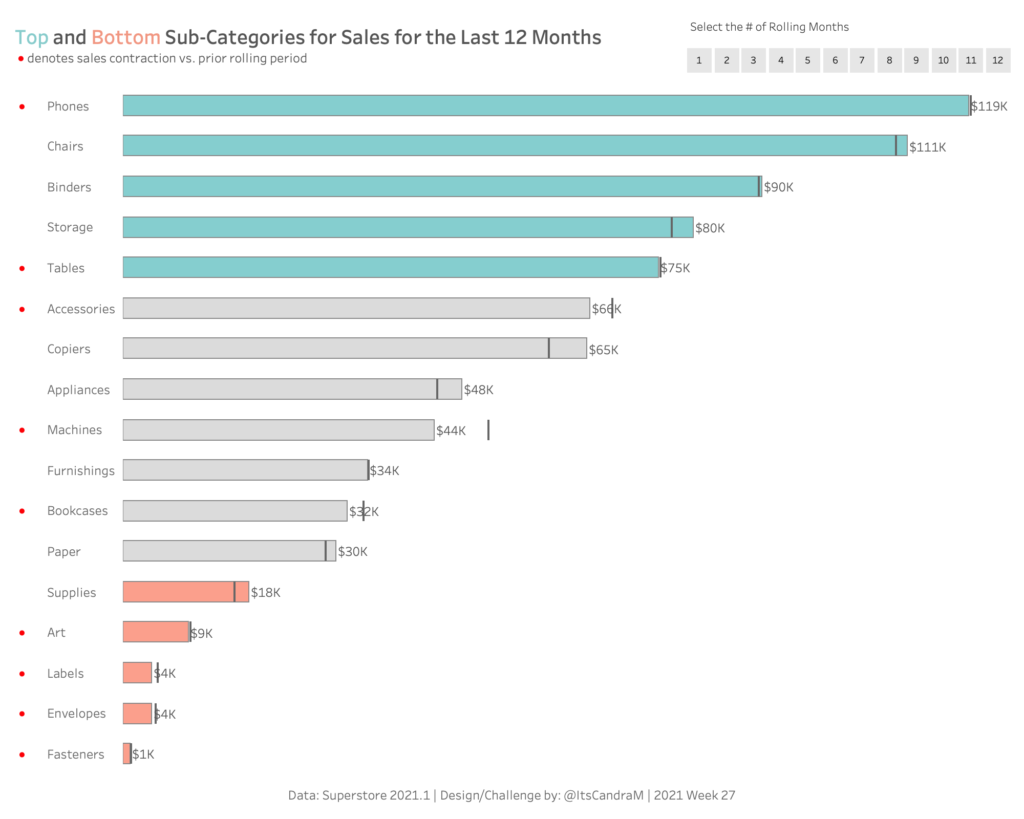
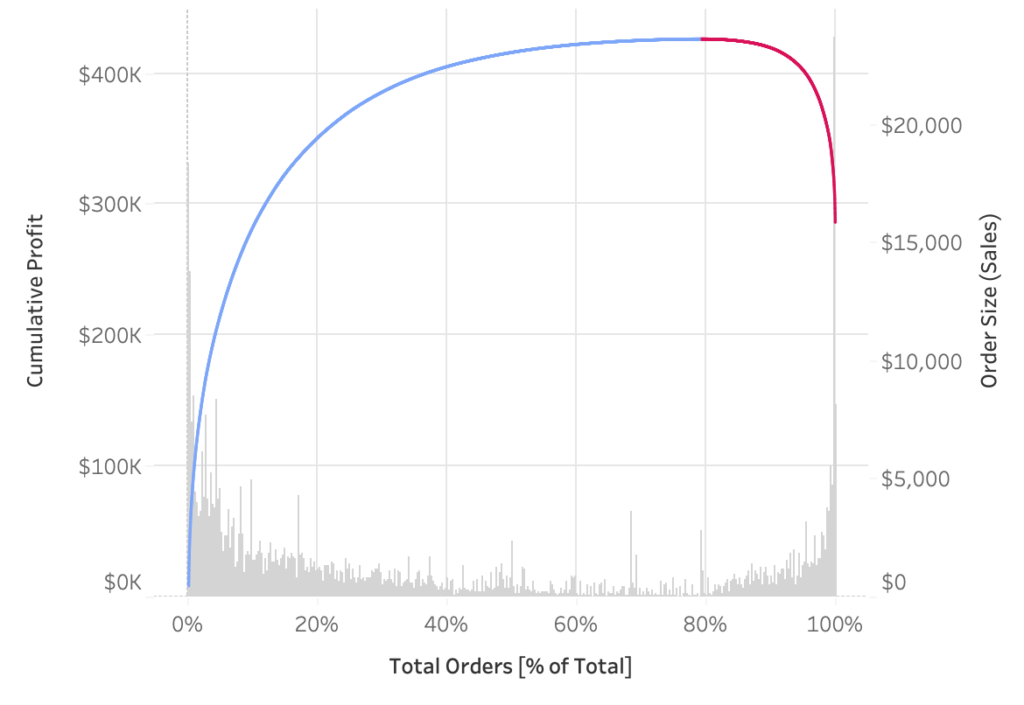
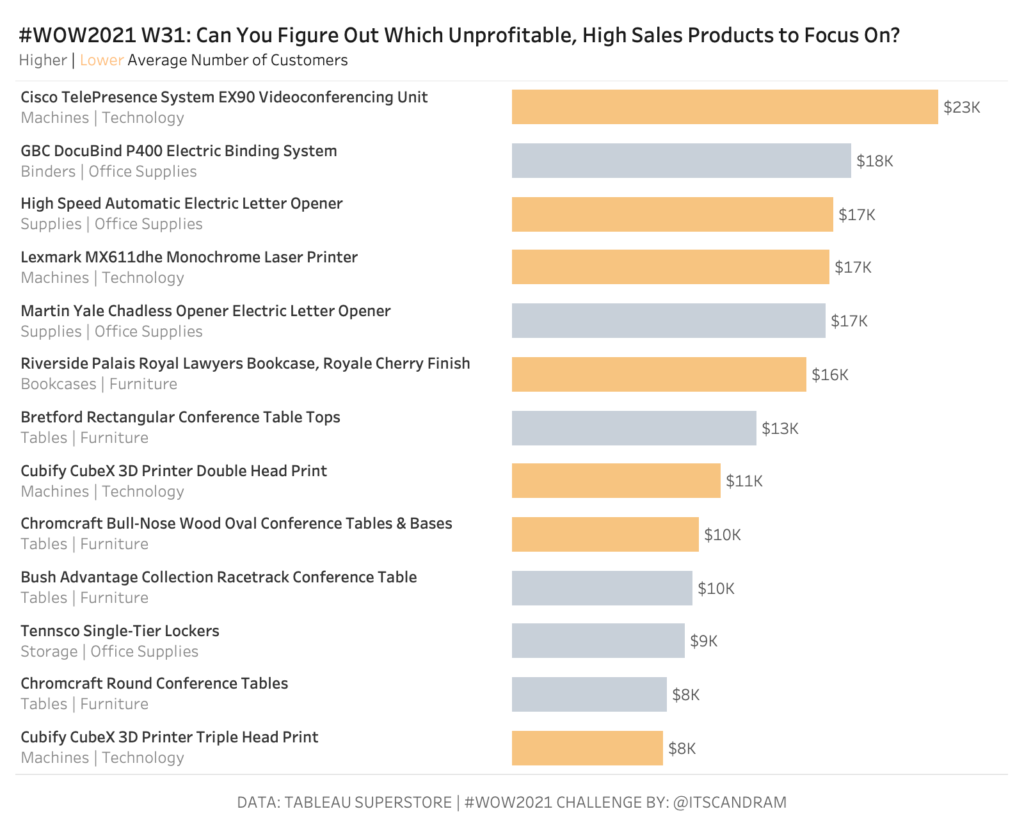
Introduction The ability to efficiently find the proverbial needle in a haystack is worth its weight in gold. How many times has a key stakeholder asked you to give them a shortlist of products (insert the focus of your analysis) to focus on for business improvement/optimization opportunities…and they’ve asked you to get back to them […]
2021 Week 31: Can You Find the Needle in the Haystack? Read More »
Tableau, Workout Wednesday