
Introduction
This week’s Workout Wednesday is brought to you by Josh Jackson. For those who don’t know, Josh is my husband! He typically prefers to stay in the background, but asked if he could borrow one of my weeks to share this challenge. Here’s the challenge in his own words:
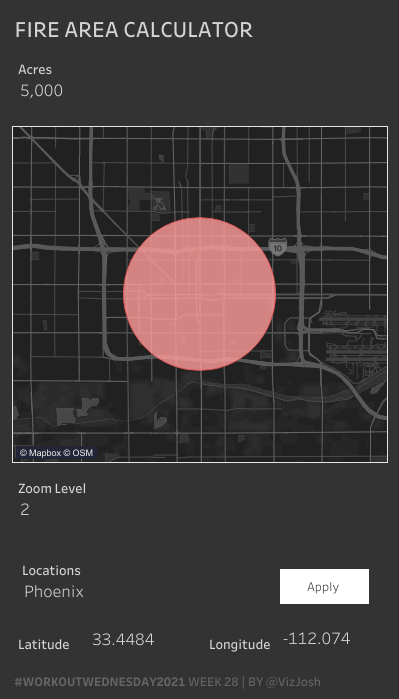
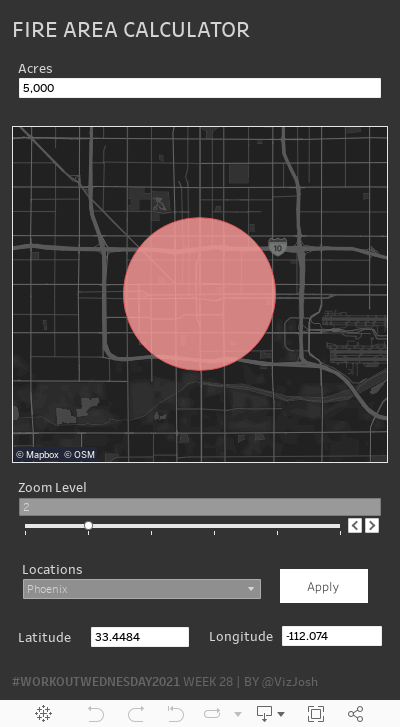
This week is inspired by a tool that I have always wanted. I like to build calculators in Tableau that don’t use any data and use Tableau’s features to make something useful. I usually make these so that they work on my phone and I can use them at any time. There are a lot of wildfires in my area of the world (Phoenix, AZ) and the news always reports the size, but I don’t have any idea how big the size is. This tool draws a circle on a map for a given number of acres. And it lets me draw that circle in a location where I know how relatively big it is.
So that’s the challenge for the week! Build an easy-to-use calculator that can quickly give you an idea of how big something is in acres.
For context, the largest recorded wildfire in Arizona is the Wallow Fire of 2011, which burned more than 522,000 acres. This year, the largest fire to date here in AZ is the Telegraph Fire (recently contained on 7/4/21), which burned more than 180,757 acres.
Grand Canyon National Park (also in Arizona) is 1,218,375 acres (1,904 square miles).
Requirements
- Dashboard Size: 400px by 700px
- # of Sheets – 2
- Create a map that shows circle the size of the number of acres entered
- Freebee: acres to feet calculation: SQRT(([Acres]*43560)/PI())
- Disable all map controls
- Allow users to zoom to pre-determined levels (1,2,5,10,50,500 times the size of the circle on the map)
- Allow users to pick pre-determined locations or enter custom coordinates (use your own locations that apply to you)
- Apply button needs to clear itself
You’ll need a version of Tableau with Map Layers (minimum 2020.4)
Dataset
Copy paste this into Tableau to get started. Avoid connecting to a file if possible!
Data,
1,
2,
3,
4,
5
Attribute
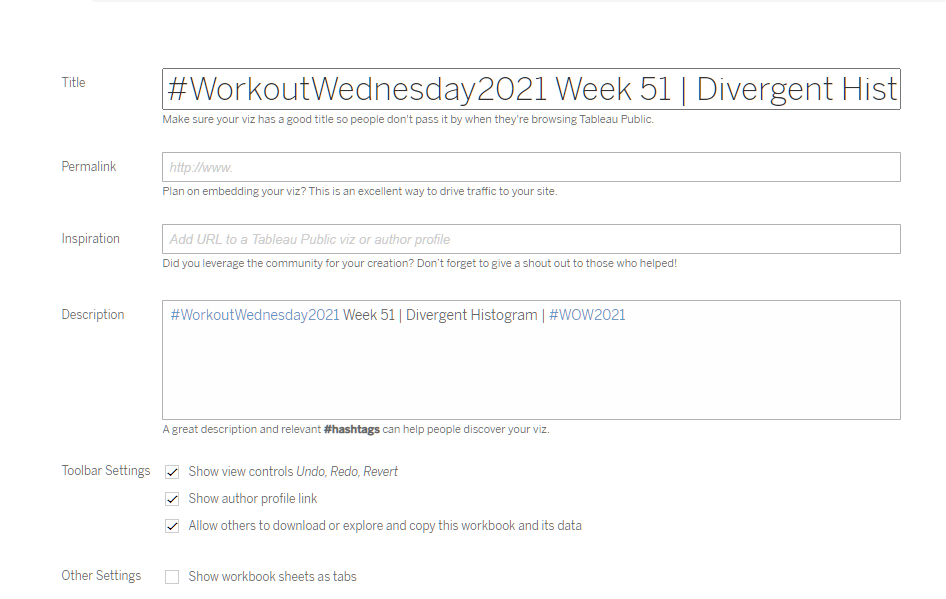
When you publish your solution on Tableau Public make sure to take the time and include a link to the original inspiration. Also include the hashtag #WOW2021 in your description to make it searchable!
Share
After you finish your workout, share on Twitter using the hashtag #WOW2021 and tag @vizJosh, @AnnUJackson, @ItsCandraM, @LukeStanke, @_Lorna_Brown and @HipsterVizNinja
Solution
Interactive
I can not find dataset. Anyone please help me to find out the dataset.