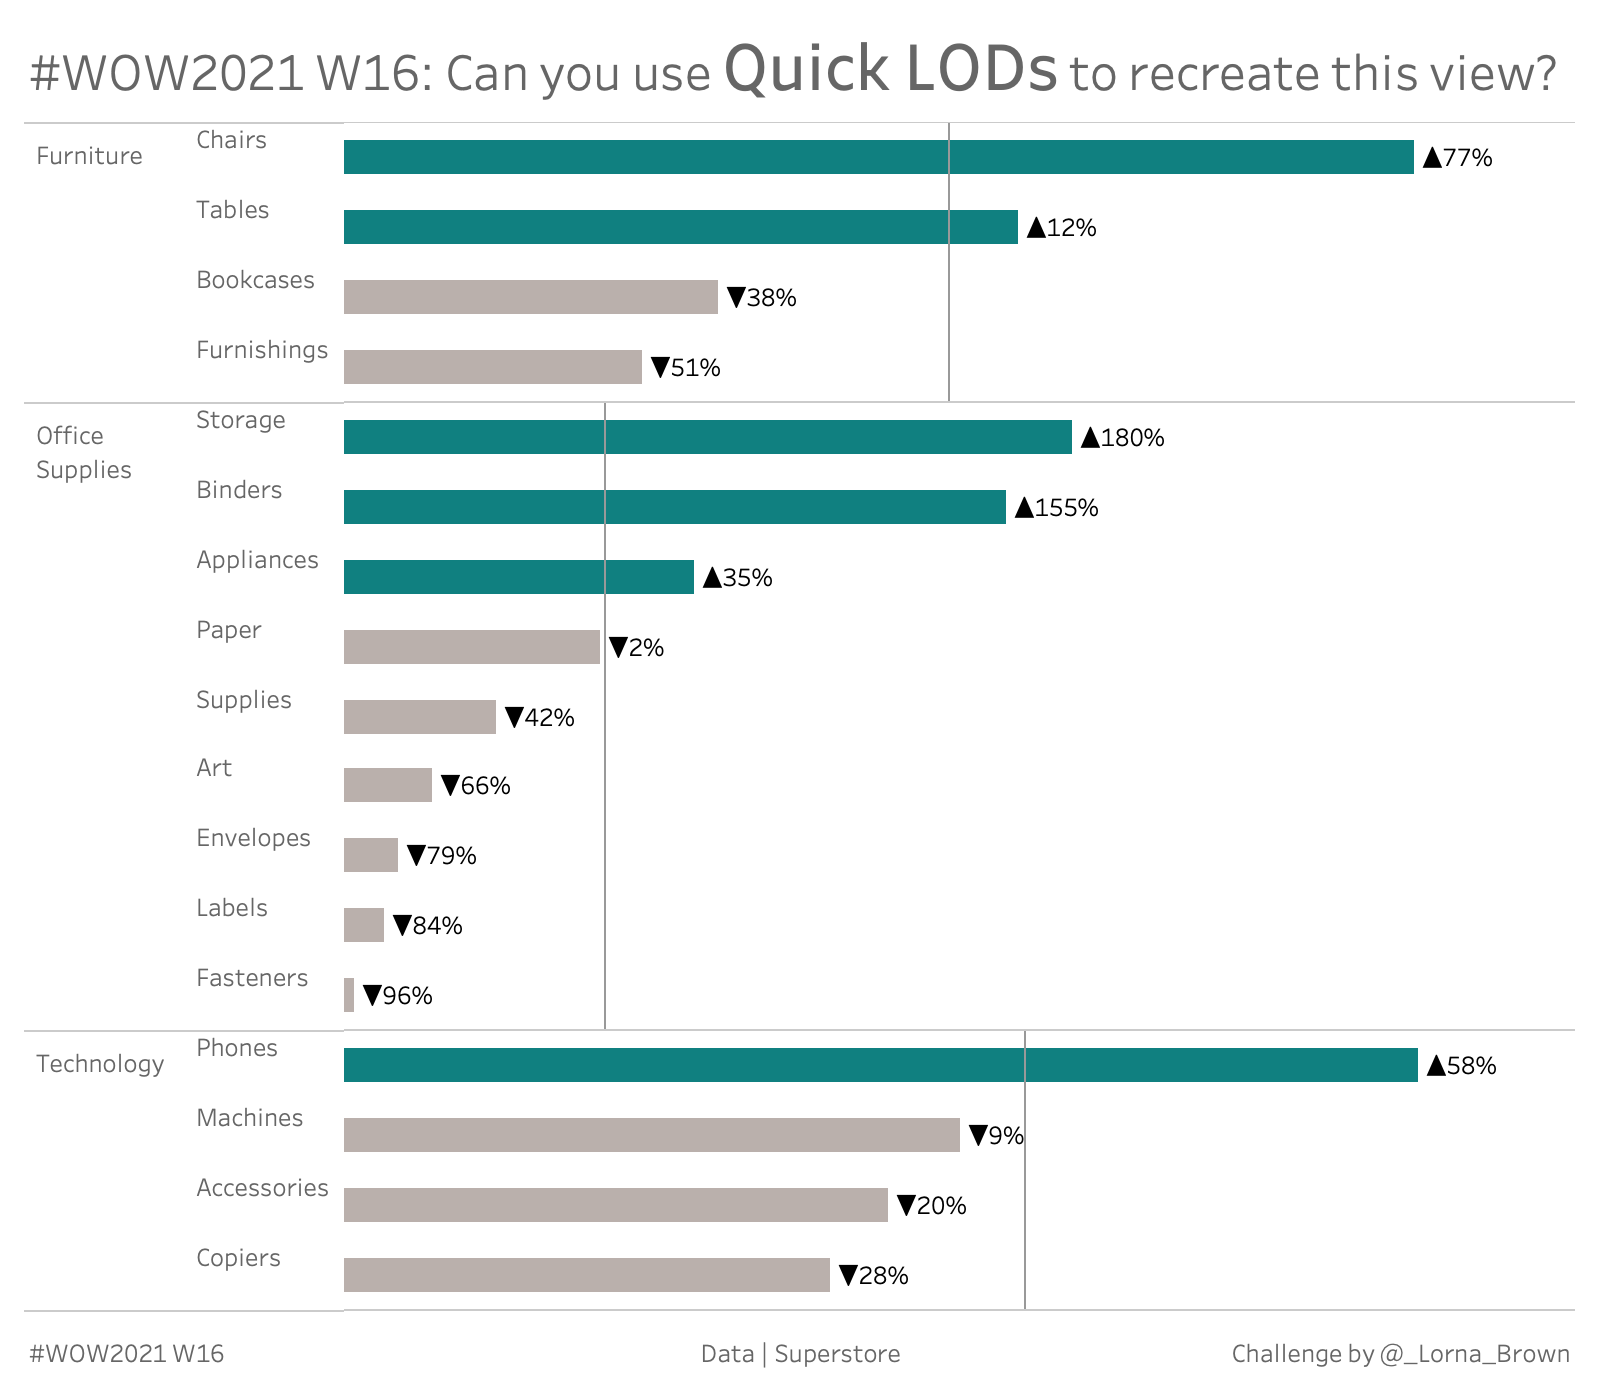
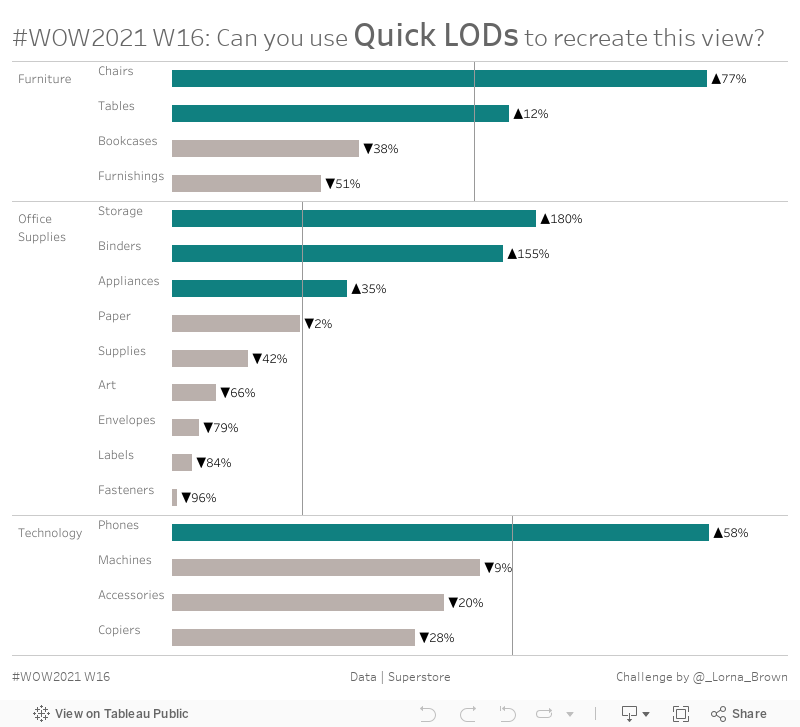
Create a dual axis chart which shows the Sub-Category Average Sales by Category
QUICK LODS only for the Average
Match formatting and colours
Hint: To create Quick LODs you can either press Control / Command on the measure and drop onto the dimension or press shift and select measure and dimension, then create, LOD.
Dataset
This week uses the superstore dataset for Tableau 2021.1. You can get it here at data.world
Attribute
When you publish your solution on Tableau Public make sure to take the time and include a link to the original inspiration. Also include the hashtag #WOW2021 in your description to make it searchable!

Hi, How come the number format ( 0%🔺;0%🔻) picked up the percentage correctly. Can you please explain (( 0%🔺;0%🔻) this part.
Very useful. Thanks Lorna