
Introduction
This week’s goal is to create a bi-dimensional chart (alternative parallel chart) that reveals if your budget has recovered or not. Parallel Coordinates represent multi-dimensional data across a set of vertical axis- different measures have different scales -, for this week’s challenge you will have to figure out how to show 2 different measures on one axis on a single chart.
Requirements
- Dashboard Size: 1000px by 700 px
- Create a polygon chart that shows Review, Budget, and Revenue per sub-category
- Use 3 tables as 1 source to plot the 3 different measures
- Each sub-category should intersect the axis at the appropriate value and all measures should be on one sheet
- The left vertical axis should show Avg Review per sub-category
- The right vertical axis should show Budget and Revenue per sub-category
- Fixed your axis
- Label the left vertical line with its measure name – Avg REVIEW
- Add Labels next to the right vertical line (at the top – REVENUE and at the bottom – BUDGET)
- Show dots and Labels (Sub-category, Avg Review) at the data points of Avg Review axis
- The color of the revenue line is based on profitability. If the Revenue is less than Budget then it is a Red.
- Create the chart to an expandable version – for one-click show the sub-categories side by side and for one-click merge them.
- Match tooltips and all formatting
- Chart color
- #666666 – Grey (opacity 30%)
- #888888 – Dark Grey
- #FF6B6B – Red
- Text color – #333333
- Chart color
Useful resources: Change in Profit and Sales Visualizations & Polygon BarCode
Dataset
Data from this week is prepped by me. You can download it here at data.world
Attribute
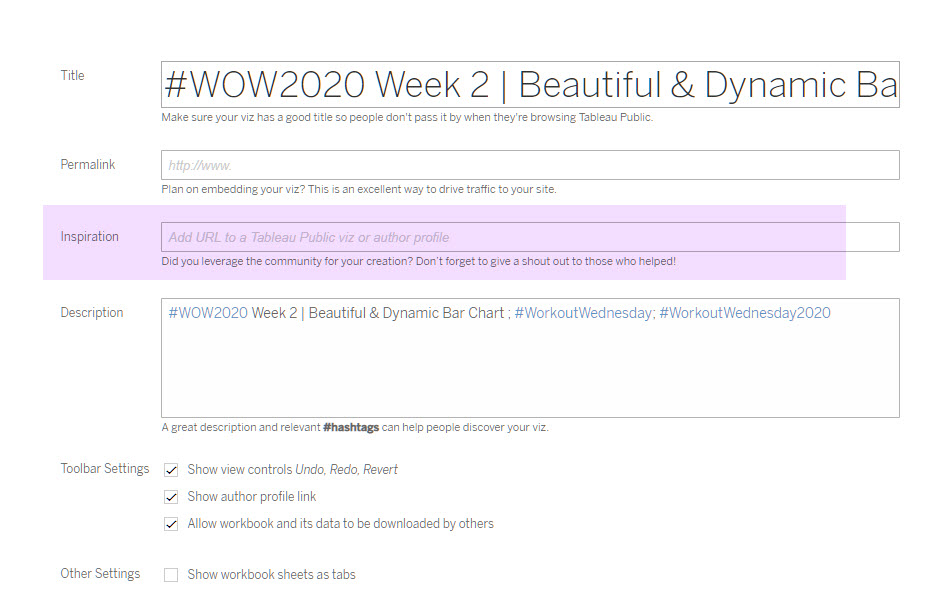
When you publish your solution on Tableau Public make sure to take the time and include a link to the original inspiration. Also include the hashtag #WOW2020 in your description to make it searchable!
Share
After you finish your workout, share on Twitter using the hashtag #WOW2020 and tag @AnnUJackson, @LukeStanke, @_Lorna_Brown, @HipsterVizNinja and @IvettAlexa
Am I missing something? The budget for Tables is higher than the Revenue for Labels. Shouldn’t the top of the polygon for Tables go higher than the polygon for Labels then?
Hi Rob,
Labels sub_category has higher Revenue(198) than Tables(80), that’s why the Revenue line of the Labels sub_cat is higher than Tables.
Tables sub_category has higher Budget(200) than Labels(140), that’s why the Budget line of the Tables sub_cat is higher than Labels.
I hope it makes sense.