Month: July 2020

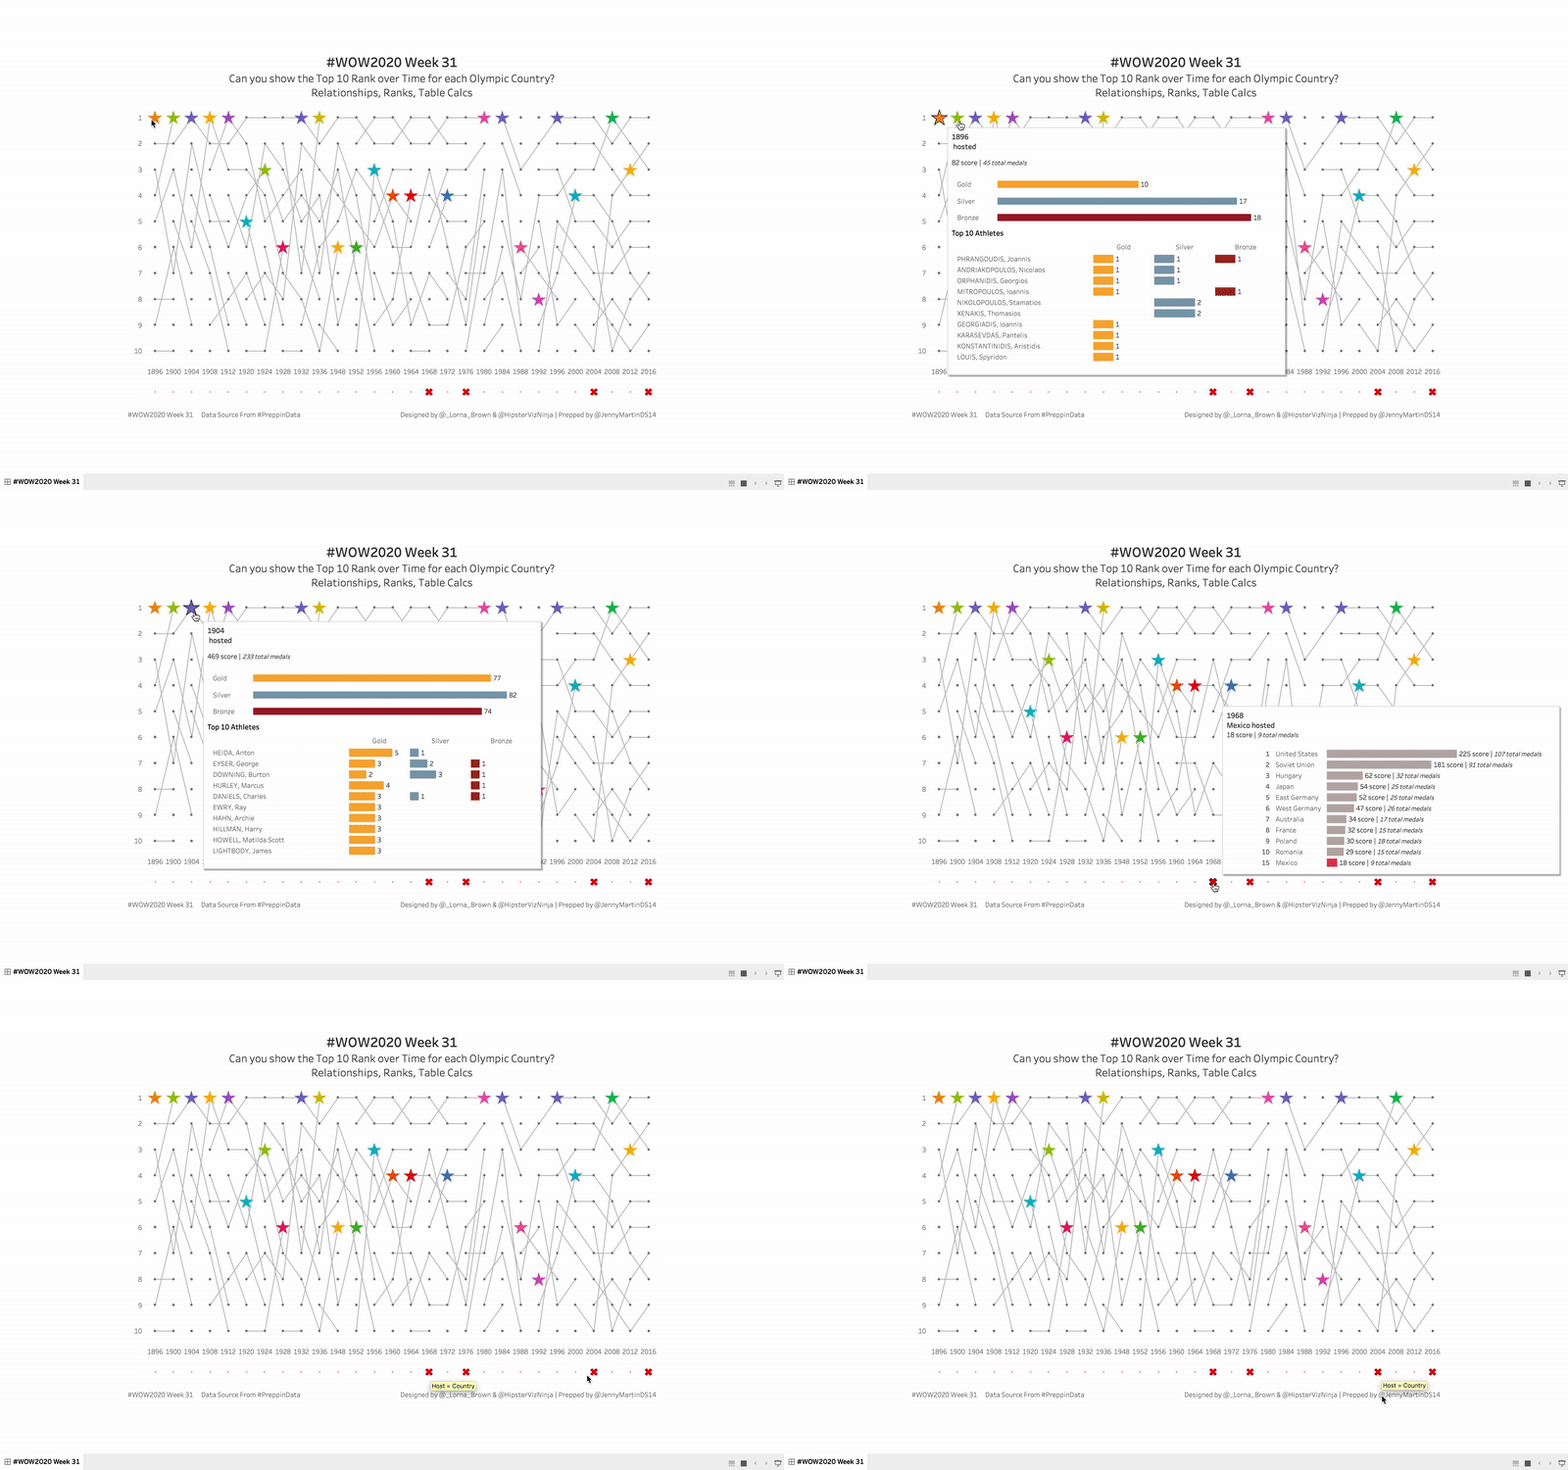
2020 Week 31 LIVE: Can you show the top 10 rank over time for each Olympic country?

Introduction For this weeks challenge we are doing a Live collaboration with Preppin’ Data. Where you work through the data prep and then use the outputs to build in Tableau. This is a live event happening on Wednesday 29th July 2020, 4pm BST. The idea of the collaboration allows you to have a look inside …

2020 Week 31 LIVE: Can you show the top 10 rank over time for each Olympic country? Read More

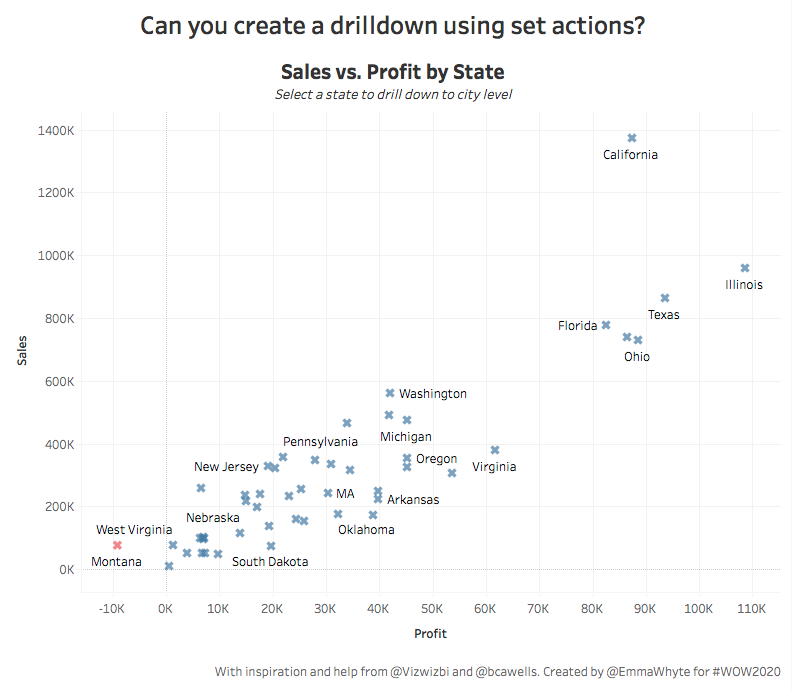
2020 Week 30: Can you create a drill down using set actions?

Introduction Hey #WOW2020, Emma Whyte here. It’s been a blast being back building a Workout Wednesday! It’s been about 2 years 7 months since my last WOW with Andy Kriebel when we kicked off this project in 2017. It’s been fun, and a little bit stressful, getting back into the mindset of setting a weekly …

2020 Week 30: Can you create a drill down using set actions? Read More

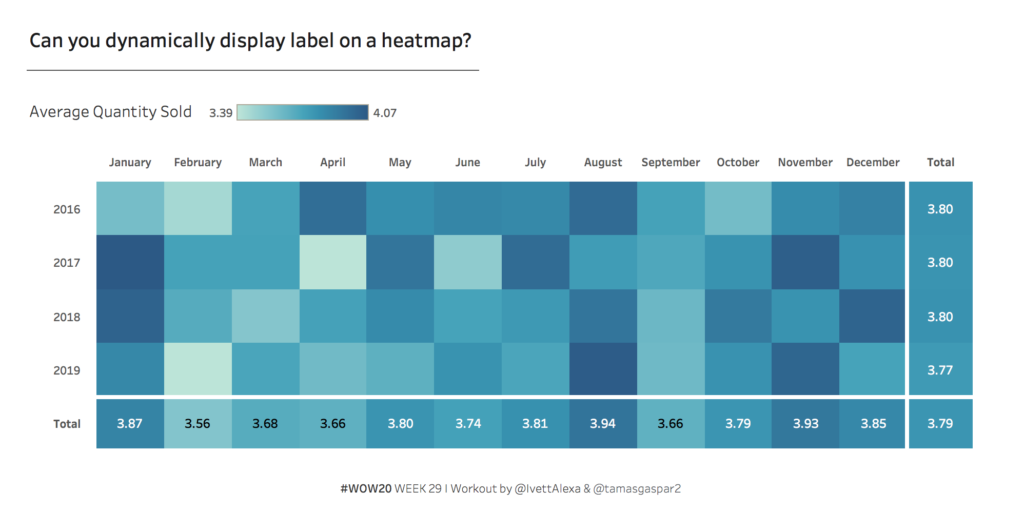
2020 Week 29: Can you dynamically display label on a heatmap?

Introduction The topic week is based on a recent project of my colleague, Tamás Gáspár, with whom I had the opportunity to make this super challenge for you guys. Heatmaps are a chart better suited to representing a more generalised view of numerical data, as it’s harder to accurately tell the differences between colour shades …

2020 Week 29: Can you dynamically display label on a heatmap? Read More

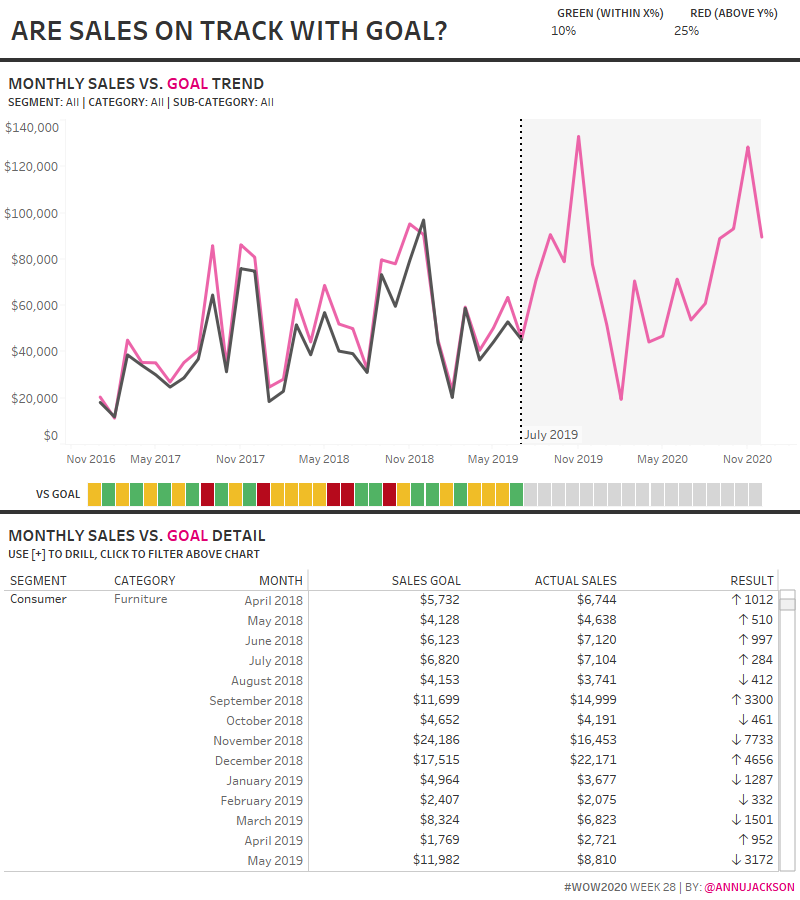
2020 Week 28: Are Sales on Track with Goal?

Introduction Congratulations!  We are now halfway through 2020 – it’s been a remarkable year, certainly full of twists, turns, and the unexpected. The purpose of this week’s challenge is to demonstrate how a metric compares to a goal.  Like most goal data I encounter, the sales goals for this challenge don’t reside in the same …

2020 Week 28: Are Sales on Track with Goal? Read More

Scroll to Top