Introduction
Hi friends! Well, it’s been a quarter since my last challenge so you know what that means, it means we’ve got a new version of Tableau to check out! A couple weeks ago, 2020.3 was released and with it came a whole host of new awesome features and functionality! As always, #WOW2020 is here to help you get familiar with a couple of those new features.
The Features
One of the best things to come out of this new version is ability to relate two logical tables together via a calculation. This is very similar to join calculations but work with noodles!
The other feature/enhancement we’ll be checking out is the ability to easily create a default value for a parameter when we clear our selection. Tableau Zen Master, Kevin Flerlage wrote a great article about this feature last week. Feel free to check it out to help you along!
The Challenge
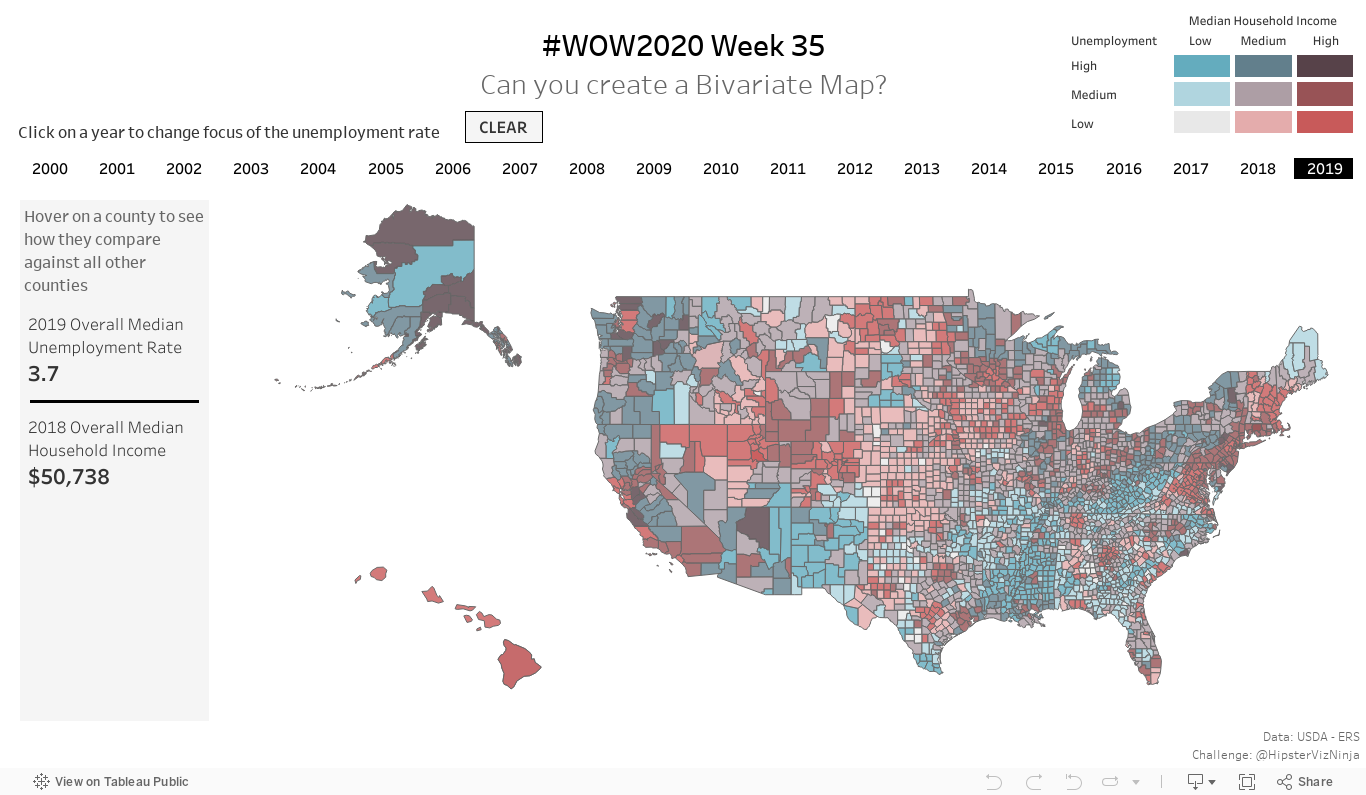
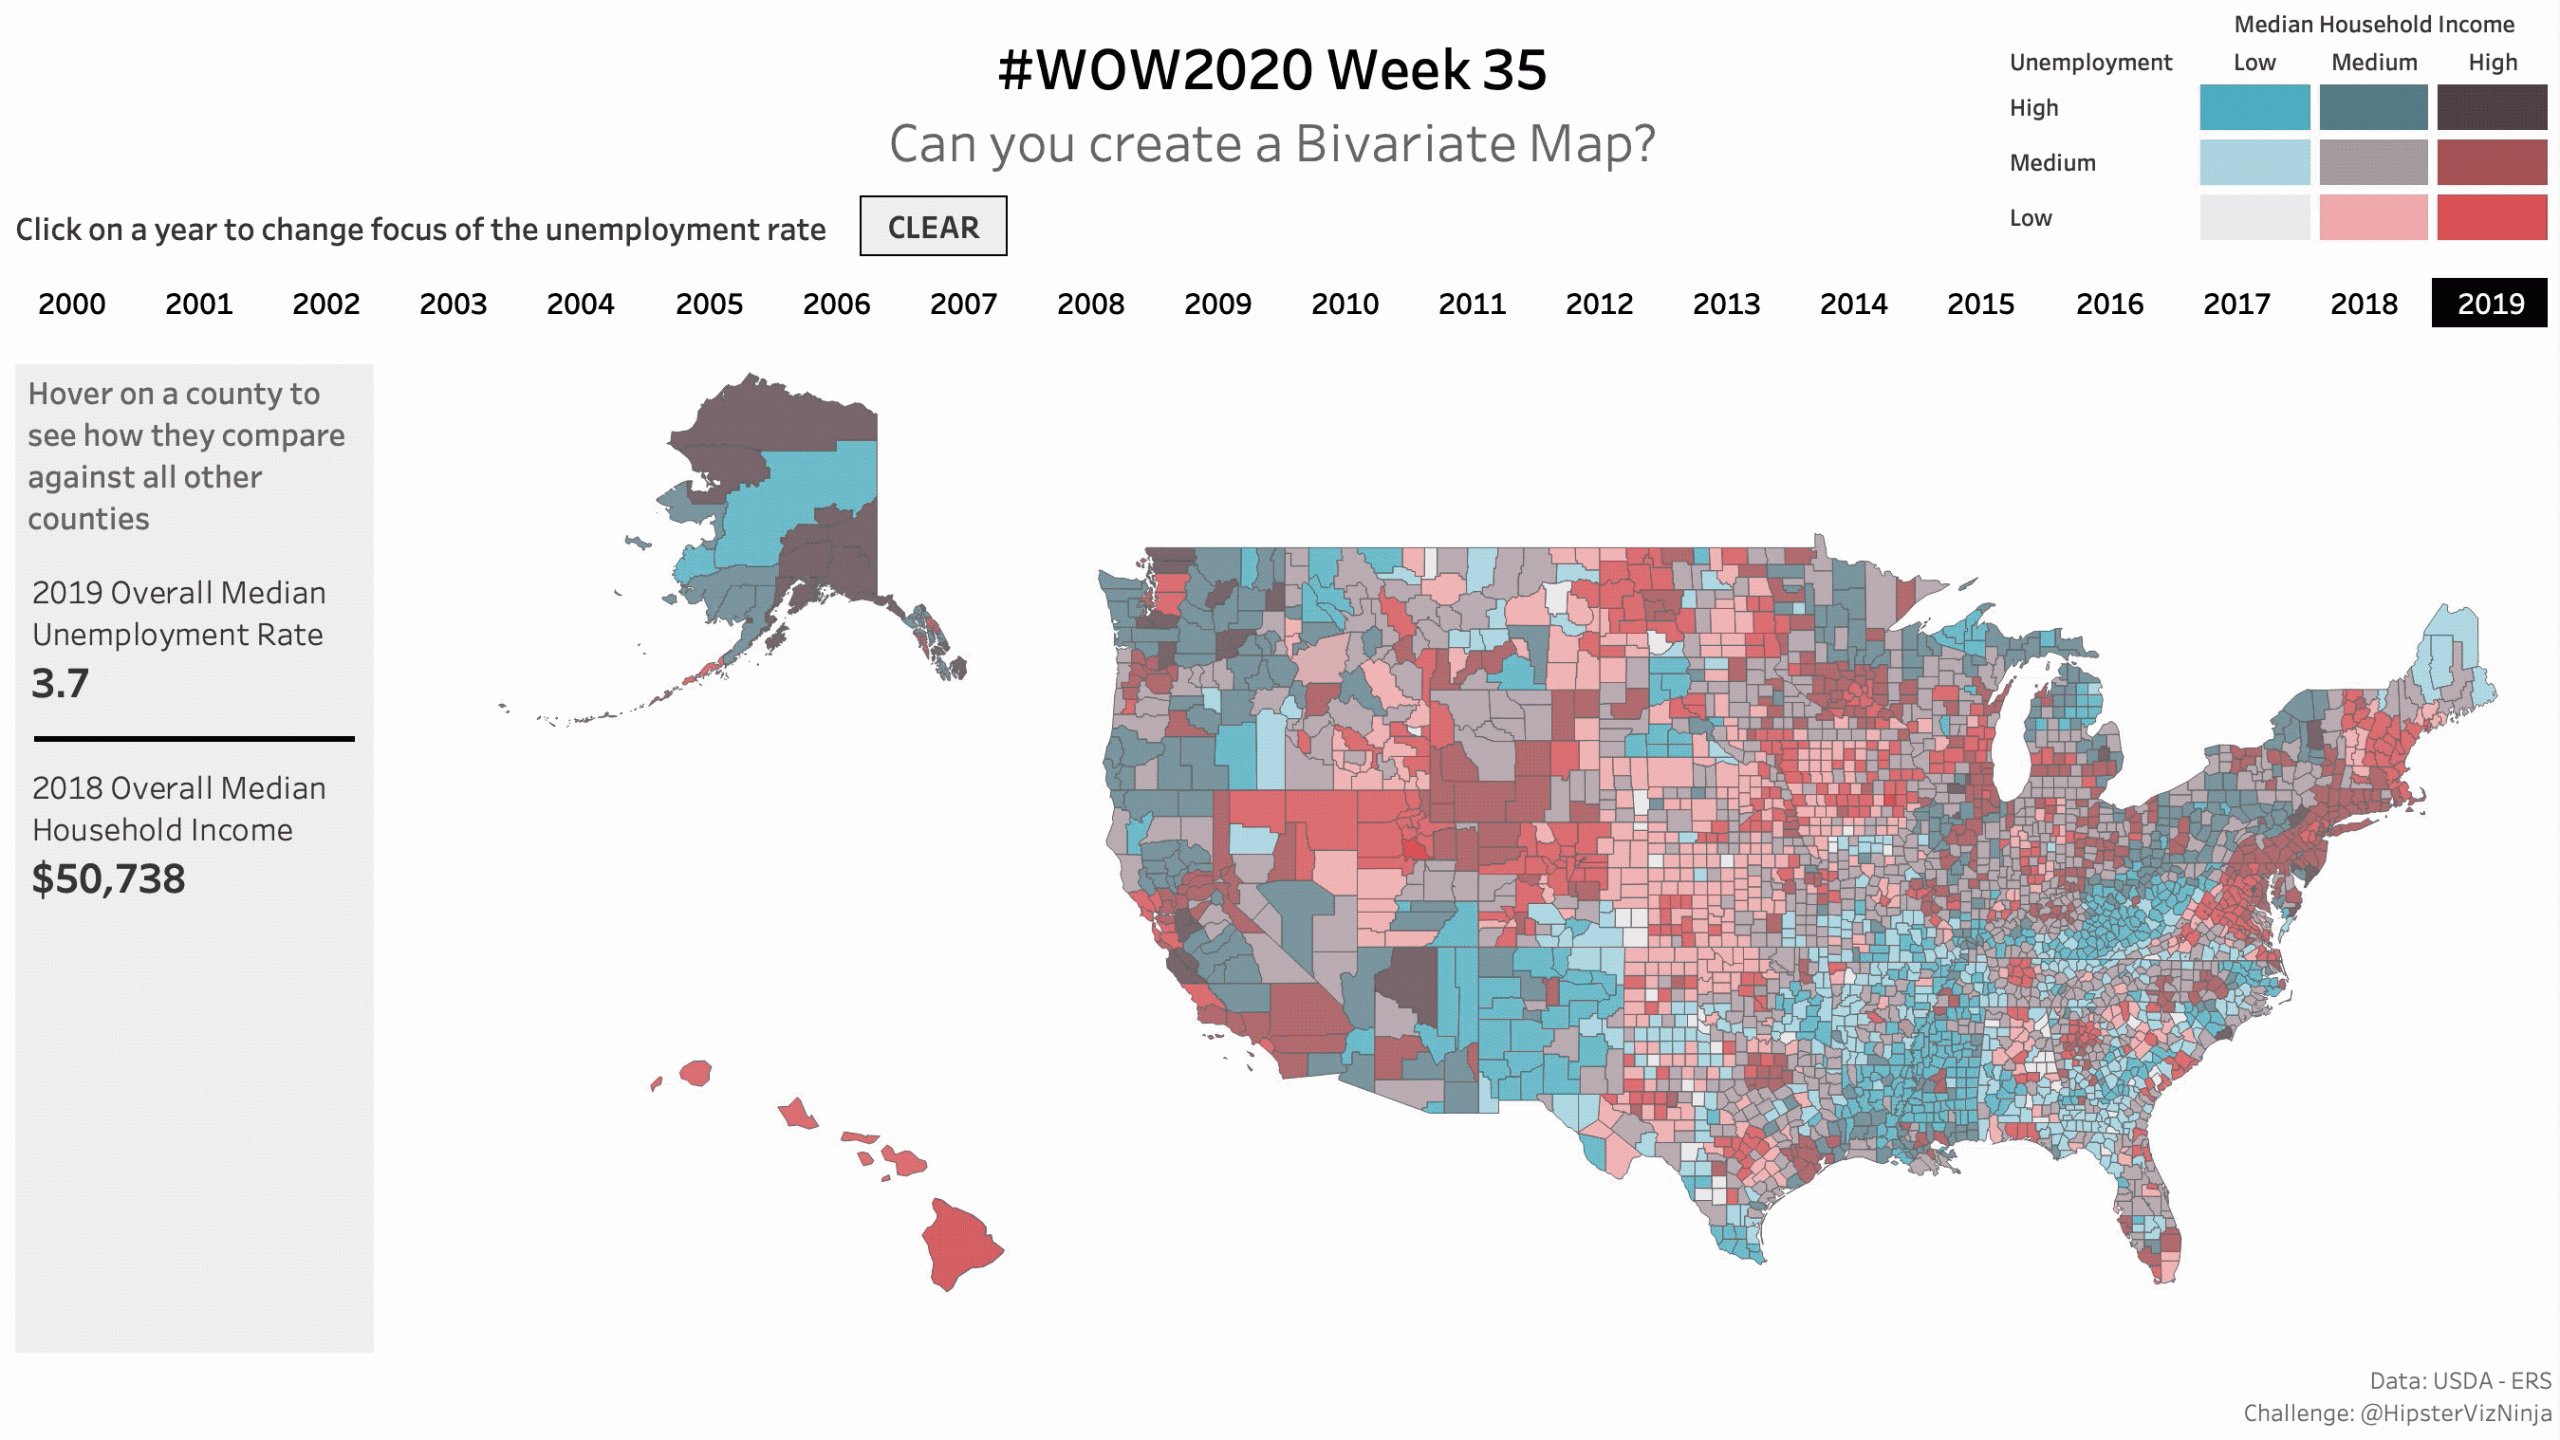
MAPS!!! Everyone loves ’em but they can be a bit intimidating so we’re going to be work on that with one of my favorite map charts. Bivariate maps allow for analyzing a single dimension against two measures quickly and easily. A bivariate map is essentially a mashup of two maps with two color scales. For this challenge, we’re going to be looking at the historical unemployment rates between 2000 and 2019 compared to the median household income for 2018 only for every county in the country.
And for funsies, I threw in a custom color legend too!
Requirements
- Dashboard Size: Generic Desktop
- # of Sheets – up to you
- Relate the Lookup Table to the 2 fact tables
- FIPS code is a concatenation of State code and county code
- Create a county-level map
- exclude Puerto Rico
- Compare the county level measures to the 25th and 75th percentile values for each measure
- Low is <= 25th percentile
- Medium is between 25th and 75th percentile
- High is above 75th percentile
- Create a year list for users to click to filter
- Create a KPI card on the left side bar
- Create a custom 9-box legend in the upper right corner
- Colors
- Pick a palette from Joshua Stevens excellent blog post related to bivariate maps. I recommend reading the whole post but the palette’s are at the very bottom of the article
- Match Tooltips
Dataset
This week uses three custom tables. You can get it here at data.world
Attribute
When you publish your solution on Tableau Public make sure to take the time and include a link to the original inspiration. Also include the hashtag #WOW2020 in your description to make it searchable!
Share
After you finish your workout, share on Twitter using the hashtag #WOW2020 and tag @AnnUJackson, @LukeStanke, @_Lorna_Brown and @HipsterVizNinja
Solution
Interactive