Power Query

2022 Week 51 | Titles of Christmas Movies

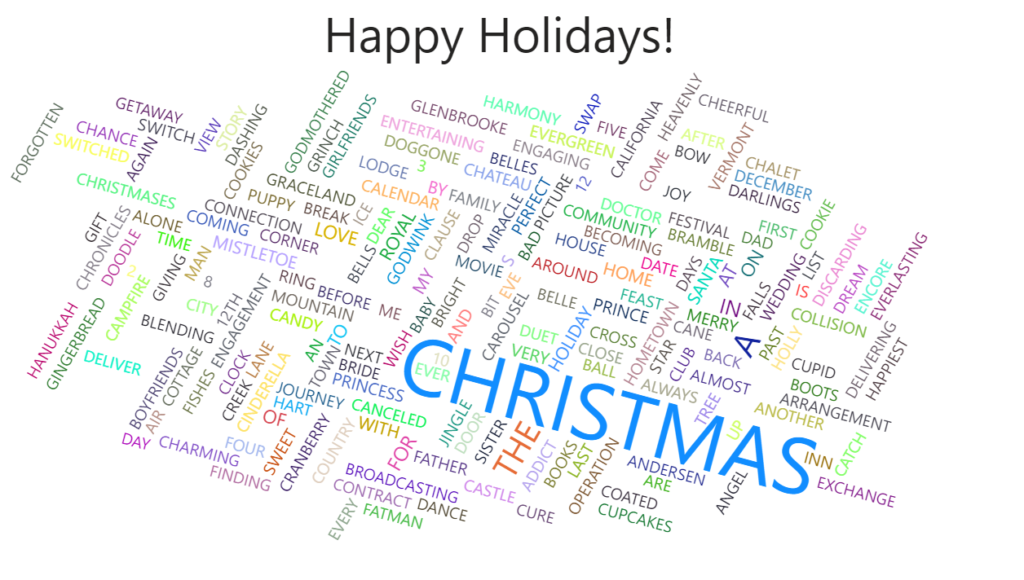
Introduction Me and my family love sitting down and watching Christmas movies during the holiday season! In this challenge we are going to be breaking down the words used in Christmas movie titles. Check out the word cloud that we are going to be creating below! Requirements Power Query In order to get this data …

2022 Week 51 | Titles of Christmas Movies Read More

2022 Week 23 | Collab with Preppin Data – Salesforce Opportunities

Introduction Welcome back to Workout Wednesday! This week is our annual collaboration with Preppin’ Data and the Tableau team! This week we’re visualizing Salesforce data – looking at current open opportunities, and trying to distinguish the dollar amount of opportunities due to close this month. This week’s challenge can be done in both Power BI and Tableau, and …

2022 Week 23 | Collab with Preppin Data – Salesforce Opportunities Read More

2022 Week 10 | Power BI: Risk Matrix

Introduction Your challenge this week is to create a Risk Matrix with some supporting visuals.  We decided to keep the project management theme going this week.  If you did not do last week’s challenge, I highly recommend you checkout Kerry’s Gantt Chart challenge, here.   For this challenge, I looked at a lot of possible ways to create a …

2022 Week 10 | Power BI: Risk Matrix Read More

Power BI Parallel Sets

2022 Week 07 | Power BI: Parallel Sets

Introduction Welcome to week 7 of Workout Wednesday for Power BI 2022. We are again using the Data Visualization Society‘s annual State of the Industry survey results.  This week we are looking at how we can visualize parallel sets. Although this may not be a visual that we use often, it can be very useful for multivariate analysis. …

2022 Week 07 | Power BI: Parallel Sets Read More

A power bi report that calculates contrast ratio between two colors

2021 Week 46 | Power BI: Create a Color Contrast Calculator

Introduction This week we are continuing our design theme by making a report about report design. Color is a very important element in report design. Color contrast is not only important for accessibility, it’s also an element of visual hierarchy. You can also use color contrast as a way to make elements on your report …

2021 Week 46 | Power BI: Create a Color Contrast Calculator Read More

Power Bi report with a line chart and map

2021 Week 40 | Power BI: Geocoding and Maps

Introduction We have declared October to be mapping month! This month, we will focus on maps and geospatial data. There are several different maps available in Power BI as default and custom (AppSource) visuals. This week we are going to start off simple and use the Map visual to make a bubble map.  When visualizing …

2021 Week 40 | Power BI: Geocoding and Maps Read More

Workout Wednesday Power BI Week 34 2021

2021 Week 34 | Power BI: Building a Network Diagram

Introduction This week’s Workout Wednesday we will be creating a network diagram in Power BI.  Network diagrams are useful to explore relational datasets and are often used to visualize such things as project interdependencies, and social networks.  For this challenge we will be visualizing the interconnections of actors/characters of the Love Actually movie by number …

2021 Week 34 | Power BI: Building a Network Diagram Read More

Power BI Magic Tables

2021 Week 33 | Power BI: Create Magic Tables

Introduction Tables, tables, tables…Love them, or hate them, we, Power BI developers, can’t live without them. Our users too. However, who says that we must provide our users with “normal”, old-fashioned tables? This week, with little creativity and magic, we will push table visual experience to a whole new level! The report below shows data about …

2021 Week 33 | Power BI: Create Magic Tables Read More

Wow 2021 PBI Week 30 Power BI report

2021 Week 30 | Power BI: Remove Punctuation and Count Words With Power Query

Introduction To celebrate our fourth week of Power Query month, we are going to use Power Query to analyze text data. Inspired by Chris Webb’s blog post, we are going to analyze word usage in Mary Wollstonecraft Shelley’s Frankenstein; Or, The Modern Prometheus. The Power Query techniques used in this week’s challenge are a bit …

2021 Week 30 | Power BI: Remove Punctuation and Count Words With Power Query Read More

2021 Week 29 | Power BI: Let’s Watch the Olympics!

Introduction This week we are collaborating with Preppin’ Data to get a close look at the schedule for the 2020 Olympic Games! We’re also collaborating with the Tableau team and we invite you to take a look at both challenges! With the opening ceremony 2 days away, we thought we’d visualize the schedule in our own time zone. We encourage you …

2021 Week 29 | Power BI: Let’s Watch the Olympics! Read More

Scroll to Top