parameter actions

#WOW2024 | Week 7 | Can you include and exclude options with a custom control?

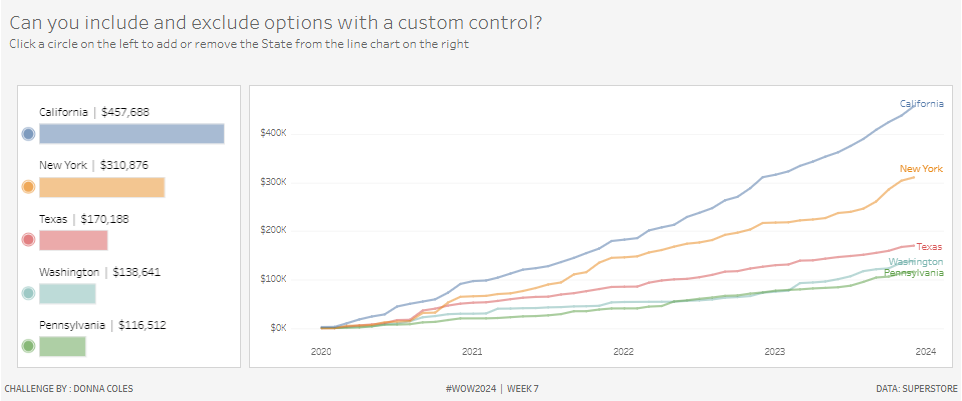
Introduction This week’s challenge is inspired by  something I’d seen at work, and I thought it would be quite fun to see if I could reproduce in Tableau and if so, share as a challenge 🙂 I could, so here it is… can you include & exclude options with a custom control? Click to open …

#WOW2024 | Week 7 | Can you include and exclude options with a custom control? Read More

Scatterplot of profit on Y Axis and sales on X Axis, with a dot for each state, colored by profit ratio.

WOW2023 Week 30: Can you build a dynamic drill down scatterplot in one view?

Introduction We’re continuing retro month this week, and I decided to re-viz Andy’s Week 41 challenge from 2017. I chose this one because I really like the concept of being able to drill down from state into city on the same chart, but I wondered if things would be easier than the calculations required to …

WOW2023 Week 30: Can you build a dynamic drill down scatterplot in one view? Read More

#WOW2023 Week 24 | Can you build a mobile KPI app?

Introduction This week’s challenge is another exploration of dynamic zone visibility, this time combined with a mobile app-like concept. Sometimes executives need just a few critical metrics at their fingertips, and this is a concept I’ve mulled around for a while (probably stemming from this concept by Anya A’Hearn) but felt like dynamic zone visibility …

#WOW2023 Week 24 | Can you build a mobile KPI app? Read More

#WOW2023 Week 18: Can you combine relative and custom date filters?

Introduction One of my favorite challenges from the past is from Week 4 2020: Can you combine relative and custom dates? I was always fielding questions if I could have a relative date filter and a date picker on the same dashboard, but hadn’t ever figured it out. After Sean’s challenge that week, I implemented …

#WOW2023 Week 18: Can you combine relative and custom date filters? Read More

#WOW2022 Week 31: Let’s build a KPI dashboard

Introduction Who doesn’t love a good KPI dashbaord? This one is fairly simple and straightforward. Let’s look at four simple metrics and see how each subcategory ranks within a selected metric. With this challenge – MIND THE NUMBER FORMATTING 🙂 Click to open in Tableau Public Requirements Dashboard Size: 700 x 350 2 sheets Display …

#WOW2022 Week 31: Let’s build a KPI dashboard Read More

#WOW2022 | Week 08 | Let’s switch those measures!

Introduction There has been an overwhelming response from the last couple of weeks series so I thought, let’s continue. How many times have you gone into a meeting with a finished dashboard and someone’s asked “Can you just…”. Well here is my “Can you just…”!! I want you to be able to switch what measures …

#WOW2022 | Week 08 | Let’s switch those measures! Read More

#WOW2021 W44: Can You Show the Top and Bottom Profit Performers for the Selected Time Period?

Introduction To round out my beginner #WOW2021 series and as a nod to the most wonderful time of the year (#TC…duh), I wanted to re-imagine a couple of blasts from the Tableau Conference past…so while no points for originality here, my hope is that the principles of these tricks of the trade will help reduce …

#WOW2021 W44: Can You Show the Top and Bottom Profit Performers for the Selected Time Period? Read More

Scroll to Top