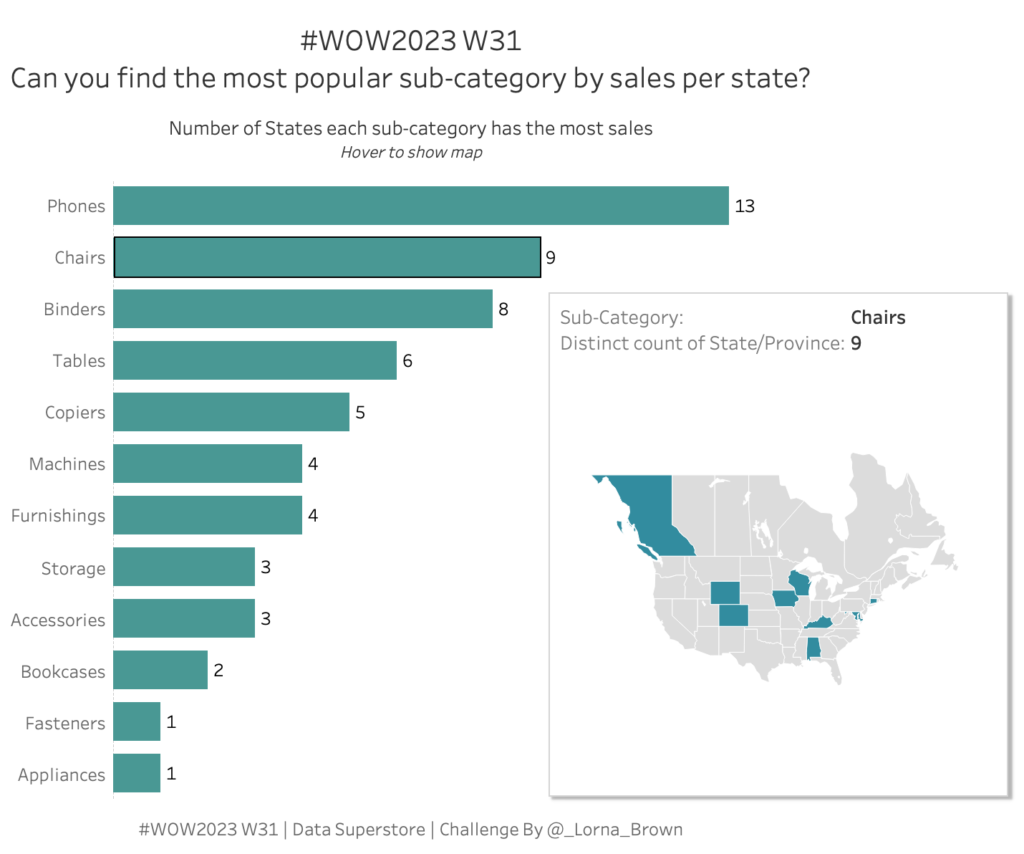
#WOW2023 W31: Can you find the most popular sub-category by sales per state?
Introduction I am a big fan of Level of Detail calculations and this one is an oldie but goodie! That is the main focus this week, but also uses Parameter Actions & Viz in Tooltips. Click to open in Tableau Public Requirements Dashboard Size: 600 x 600 Two Sheets Find the most popular sub-category by …
#WOW2023 W31: Can you find the most popular sub-category by sales per state? Read More