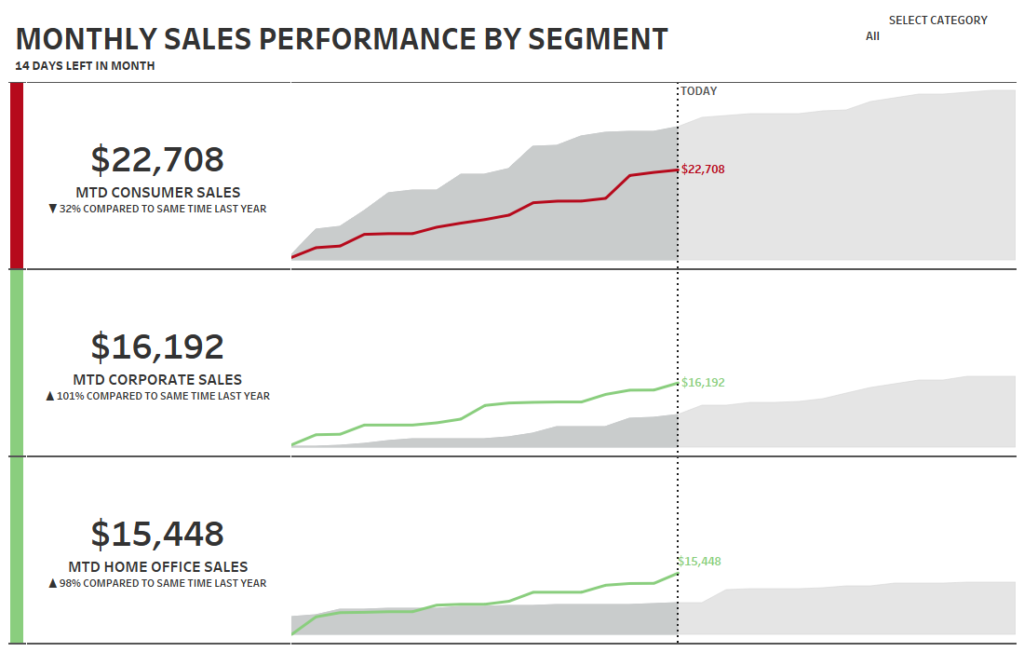
2023 Week 09 | Mobile KPI Scorecard
Introduction Not everyone wants to consume analytics through their desktop these days. We live in a busy world where people are often on the go, so we’re focussing on a mobile dashboard this week. The goal is to create a simple view that can be quickly glanced at to see our KPIs vs. last year’s …