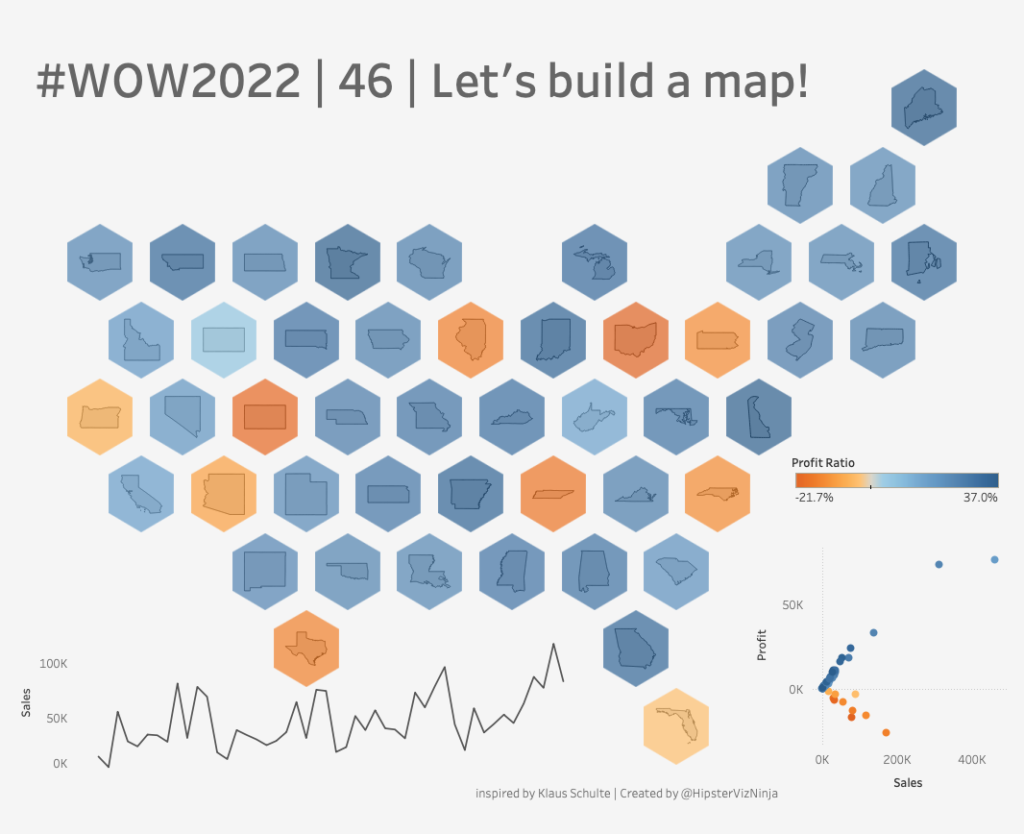
2022 Week 46 | Power BI: My Second Deneb

Introduction During week 42’s community month challenge brought to us by Thys van der Westhuizen – Thys built on my week 37 challenge – My First Deneb. For that week’s challenge I built out three basic bar charts using Deneb visuals, and subsequently, Thys continued to build a few more amazing visuals in his challenge. …

2022 Week 46 | Power BI: My Second Deneb Read More

#WOW2022 | Week 45 | Average Patient Waittimes

Introduction This week’s challenge was derived from a project that I helped some colleagues with. My colleagues were working on a client project for a travel company. They wanted to be able to compare a selected “Event Date” with an average travel day. The aim was to see if and how travel patterns might be …

#WOW2022 | Week 45 | Average Patient Waittimes Read More

How Brits met their partners

2022 Week 45 | Power BI: Ribbon Chart (Advanced)

Introduction Another Deneb visual this week – creating a custom Ribbon Chart.   This ribbon chart takes on a slightly different form than the ribbon charts you may be used to. This ribbon chart is focused on highlighting the change in rank and proportion of response types between the first and last dates of a …

2022 Week 45 | Power BI: Ribbon Chart (Advanced) Read More

2022 Week 44 | Power BI: Customer Lifetime Value

Introduction This week, our challenge is to calculate customer lifetime value by quarter using DAX.  This is an advanced challenge so buckle up! As I was working on my challenge for week 44, I stumbled upon the drafted challenge for Tableau on the same week.  The Tableau challenge was… you guessed it… developing a chart …

2022 Week 44 | Power BI: Customer Lifetime Value Read More

2022 – WEEK 44: What is the lifetime value of customers?

Introduction This is probably my favorite challenge of the year. So i’m saving it for near the end. You’ll need level-of-detail and table calculations to solve this one. For this challenge you need to calculate customer lifeftime value (in sales). While their are many ways to do this. We are going to keep this as …

2022 – WEEK 44: What is the lifetime value of customers? Read More

#WOW2022 W43: Advanced Formatting by Jeremy Anderson

Introduction Conditional formatting is a robust feature in Power BI that you can leverage to help users gain insights. Typically, we see conditional formatting applied to the table and matrix visuals. For example, you might apply a background color, font color, or icons to the values based on a set of rules.  Conditional formatting of …

#WOW2022 W43: Advanced Formatting by Jeremy Anderson Read More

#WOW2022 | Week 43 | Selected Subcategory Influence

Watch Introduction Hi Workout Wednesday friends!  I’m back, just in time for the Tableau 2022.3 release, which means we’ll be exploring Dynamic Zone Visibility.  This new feature allows you to use calculations and logic to dynamically show and hide dashboard elements (pretty powerful).  So in this challenge, you’ll get some hands on exposure to this …

#WOW2022 | Week 43 | Selected Subcategory Influence Read More

#WOW2022 | Week 42 | Can you use Tableau to estimate Aaron Judge’s home run trajectories?

Introduction Hello there, Workout Wednesday #DataFam! This week’s challenge is all about two of my passions growing up: baseball and physics. This past baseball season, New York Yankees outfielder Aaron Judge broke the 61 year old American League record for home runs in a single season set by Roger Maris in 1961 – Judge concluded …

#WOW2022 | Week 42 | Can you use Tableau to estimate Aaron Judge’s home run trajectories? Read More

2022 Week 42 | Power BI: Deneb Custom Visuals

Introduction I was recently asked by Rob Saunders if I would like to assist with a #WorkoutWednesday PowerBI challenge. To be seen in the same crowd with Kerry, Shannon, Meagan, Spencer, and Rob is such an honour. Cue the onset of imposter syndrome. After that feeling passed, Rob and I decided to continue with the …

2022 Week 42 | Power BI: Deneb Custom Visuals Read More

Scroll to Top