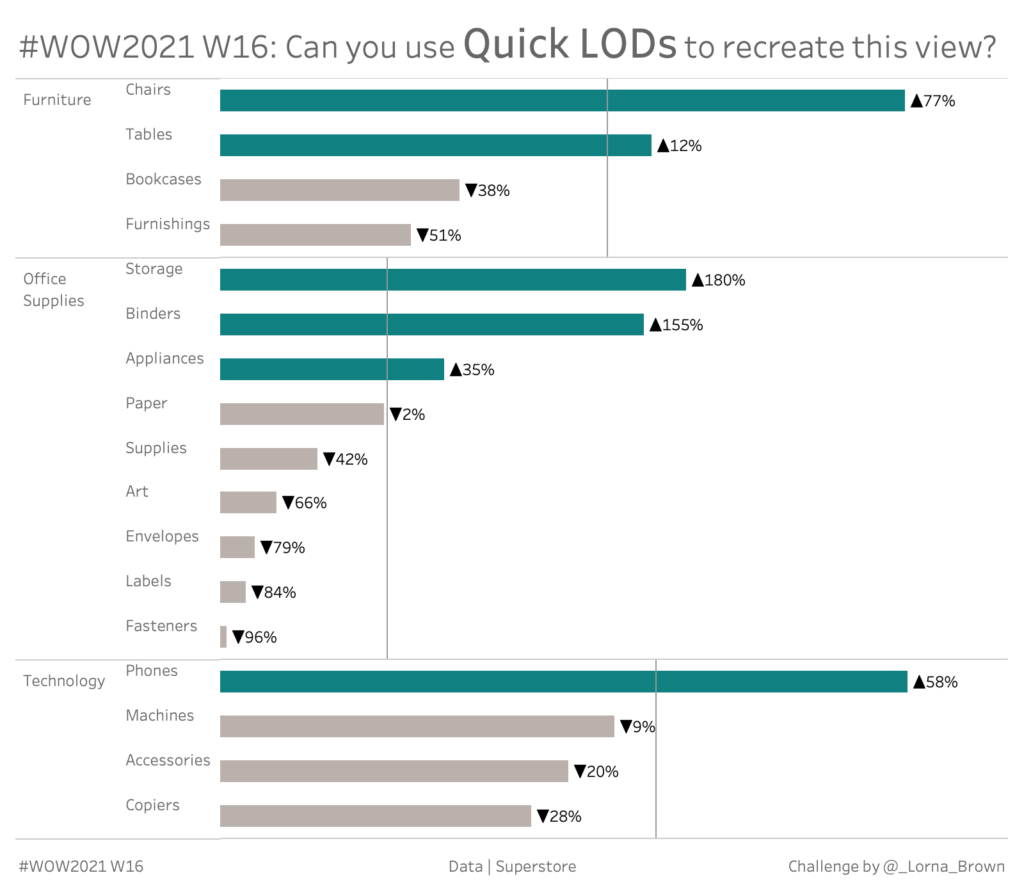
2021 Week 16 | Tableau : Can you use Quick LODs to recreate this view?
Introduction With Tableau 2021.1 being released last month, I thought it was time for a challenge. This week we focus in on the new feature of Quick LODs. Click to open in Tableau Public Requirements Dashboard Size: 800px by 700 px One Sheet Create a dual axis chart which shows the Sub-Category Average Sales by …
2021 Week 16 | Tableau : Can you use Quick LODs to recreate this view? Read More