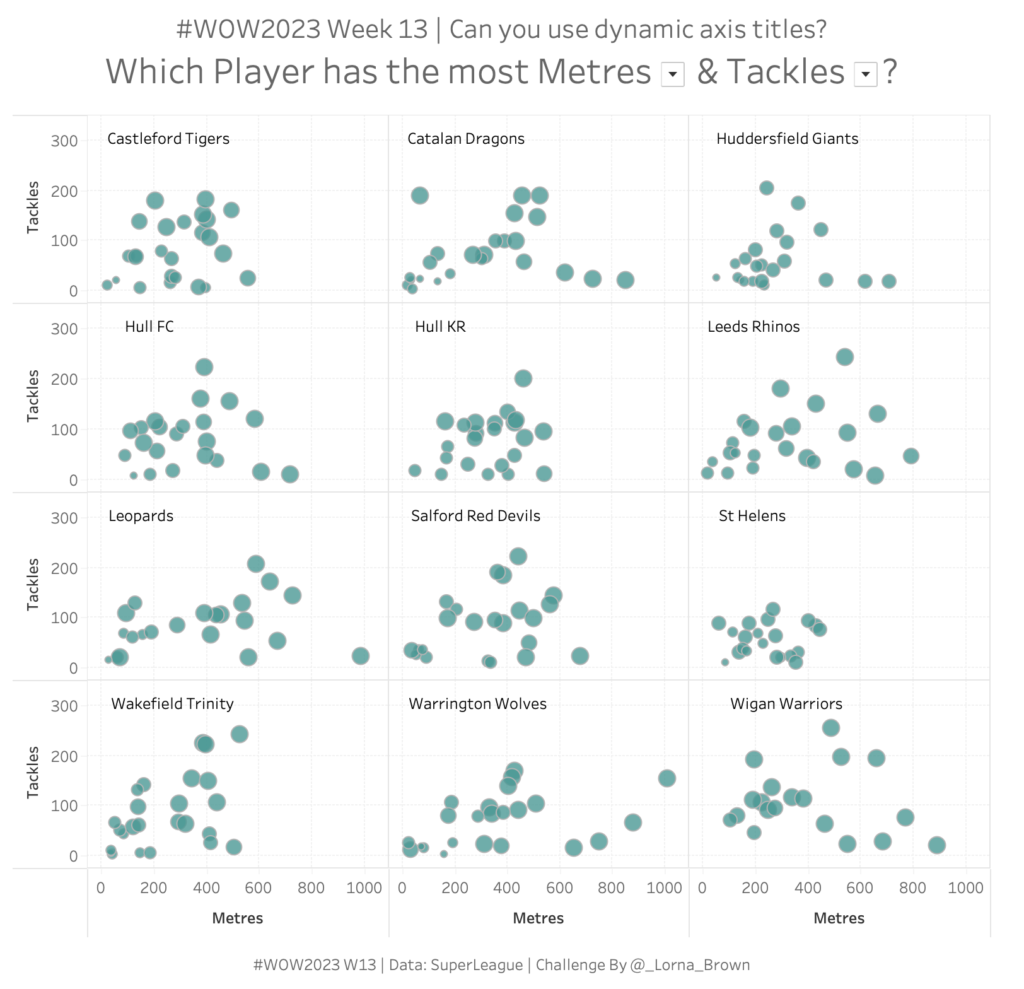
Lorna Brown

#WOW2024 | Week 3 | Can you dynamically zoom into a clustered area?

Introduction This week I wanted to test out one of Tableau’s new features, Dynamic Axis Ranges. In this exercise you want to be able to zoom into some of those clustered countries which you can then hover over to get more information about. There are, of course, some other features within this visualisation. You might …

#WOW2024 | Week 3 | Can you dynamically zoom into a clustered area? Read More

2023 W49: Can you find how many quarters it took for a customer to order again?

Introduction This week I wanted an easier challenge in the lead up to the Christmas Holidays. So what better way than doing some Level of Detail calculations. I want you to be able to find out how many quarters it took for a customer to make their second purchase Click to open in Tableau Public …

2023 W49: Can you find how many quarters it took for a customer to order again? Read More

#WOW2023 W31: Can you find the most popular sub-category by sales per state?

Introduction I am a big fan of Level of Detail calculations and this one is an oldie but goodie! That is the main focus this week, but also uses Parameter Actions & Viz in Tooltips.  Click to open in Tableau Public Requirements Dashboard Size: 600 x 600 Two Sheets Find the most popular sub-category by …

#WOW2023 W31: Can you find the most popular sub-category by sales per state? Read More

#WOW2023 Week 25: Can you calculate a percent difference between a range of dates?

Introduction I saw this visualisation floating around my twitter and trending on Tableau Public and thought it would make a great challenge for Workout Wednesday. Big thanks to Jacob for letting me use his visualisation as inspiration today! In this weeks workout, I want you to look at the percent change between two dates, we …

#WOW2023 Week 25: Can you calculate a percent difference between a range of dates? Read More

#WOW2023 Week 19: Can you create a jitterfly chart? TC23 Live Edition

Introduction I’m so excited to bring this challenge to you live from Tableau Conference 2023 and I get to be the one who created the challenge. I saw something on twitter a while back and wanted to see if I could recreate it in Tableau. This challenge is not as easy as it looks but …

#WOW2023 Week 19: Can you create a jitterfly chart? TC23 Live Edition Read More

Scroll to Top