David Eldersveld

Sample Power BI report

2023 Week 21 | Power BI: Create a Theme – With a Twist!

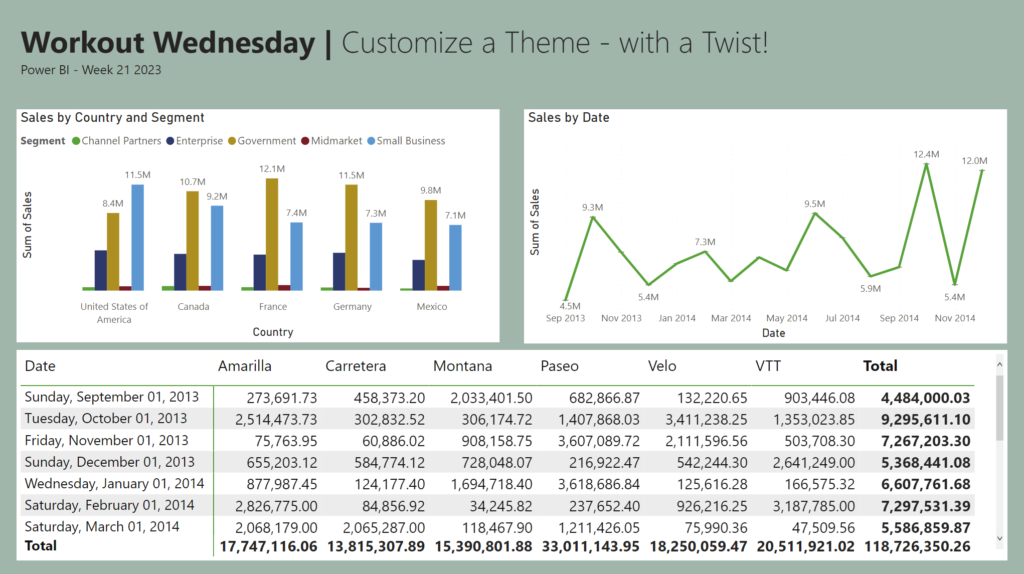
Introduction This week, we’re building on Shannon’s theme from Week 17 2022 by creating a custom Power BI theme–with a twist!   Instead of manually selecting colors, this week you’ll use OpenAI’s free version of ChatGPT (or your Large Language Model (LLM) of choice) to create a theme. You’re in control of your prompts, and …

2023 Week 21 | Power BI: Create a Theme – With a Twist! Read More

Deneb visual for Power BI

2021 Week 31 | Power BI: Declarative Visualization with Deneb

Introduction Over the course of Power BI’s Workout Wednesday challenges, you’ve had a chance to try several “custom” visuals. These are typically developed by third parties and may or may not appear on Microsoft’s AppSource marketplace. Generally, you don’t have much control over the visualization apart from whatever format options the developer creates. This week, …

2021 Week 31 | Power BI: Declarative Visualization with Deneb Read More

2021 Week 27 | Power BI: Data Transformation with Power Query

Introduction July is “Power Query Month”, where the theme is focused less on visualization and more on data preparation. Every Power BI challenge requires Power Query to get and transform data, but now we’re going deeper in July! Starting off the month, you’ll use Power Query to perform preliminary cleanup and filtering of data exported …

2021 Week 27 | Power BI: Data Transformation with Power Query Read More

Workout Wednesday Power BI Week 23 2021 Nobel Prize

2021 Week 23 | Power BI: Can You Build a Cumulative Line Chart?

Introduction Continuing with the Nobel Prize data that Meagan began exploring last week, this week extends to consider aspects of individual Nobel laureates. The main visual is a cumulative line chart, but you’ll also provide detail on laureates with a report page tooltip. While additional JSON expansion and transformation was required from the original dataset, …

2021 Week 23 | Power BI: Can You Build a Cumulative Line Chart? Read More

Scroll to Top