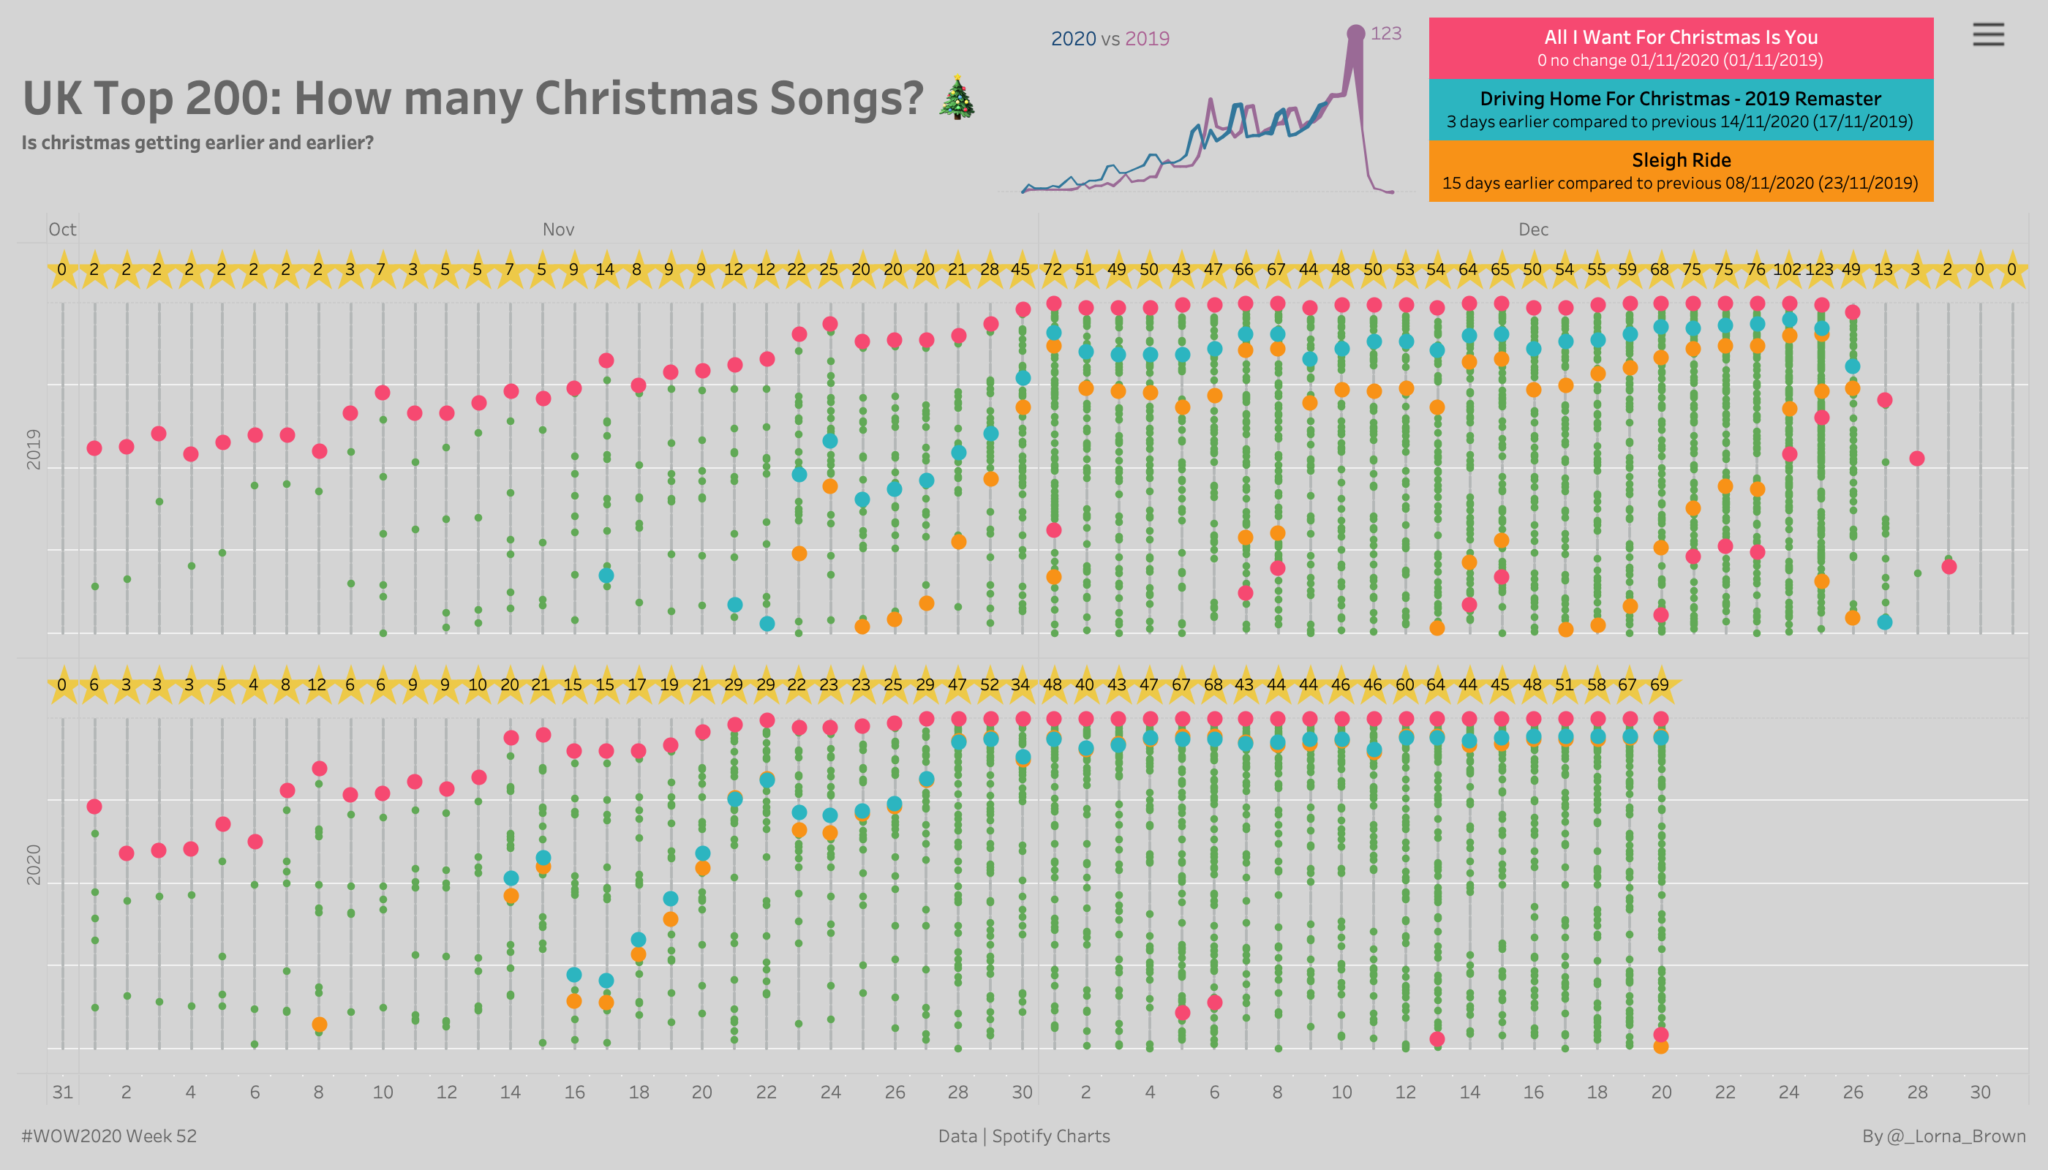
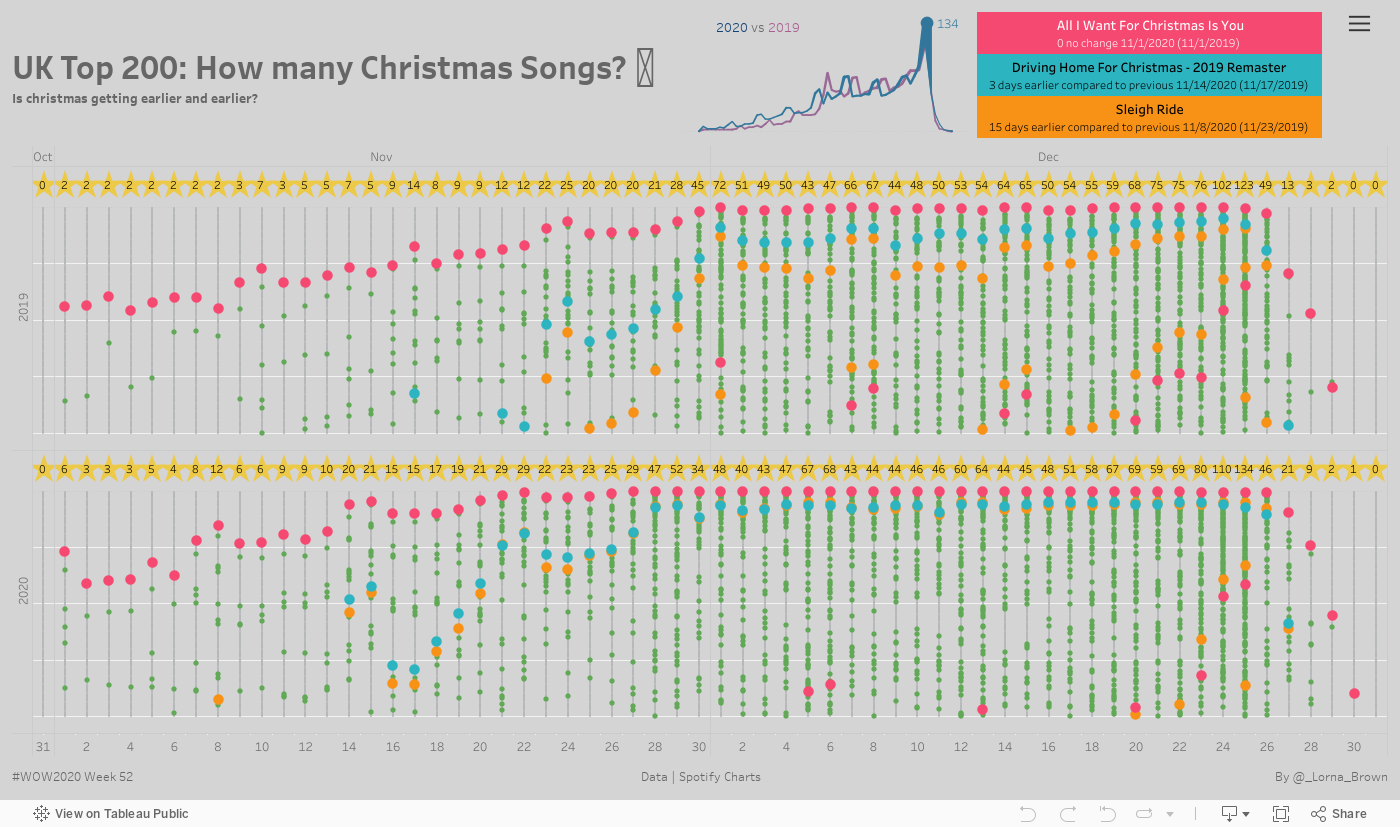
It feels like it has been a very long time since my last Workout Wednesday, but here I am with my last one of the year. I thought we would have a little bit of fun with some Christmas Songs Data. The data contains top 200 songs everyday from 31/10 to 31/12. This currently is for the UK, but if you message me I can get the data for Global or a particular country ( Hope you enjoy it.
Merry Christmas and a Happy New Year. Here’s to 2021!!
Create a dot plot with top 200 songs for everyday for 2019 and 2020
Make the Christmas Songs bigger
Highlight your top 3 Christmas songs and see if they came earlier this year compared to last
Show the number of Christmas songs over time sized by number of streams
Show your selected 3 songs and whether they came earlier or later than previous year
Finally, at the top of the dot plot, is the star of the tree which tells me how many Christmas songs were in the top 200 for that day.
Add in a set control, to allow others to select which songs they want to see
Dataset
This week uses a Google Sheet which will update daily until the end of 2020. Get it here
Attribute
When you publish your solution on Tableau Public make sure to take the time and include a link to the original inspiration. Also include the hashtag #WOW2020 in your description to make it searchable!