After many weeks of practical challenges. I’ve decided to switch it up this week. If I’m being honest I’ve been saving this challenge since August of last year (it’s still not the oldest challenge I am saving).
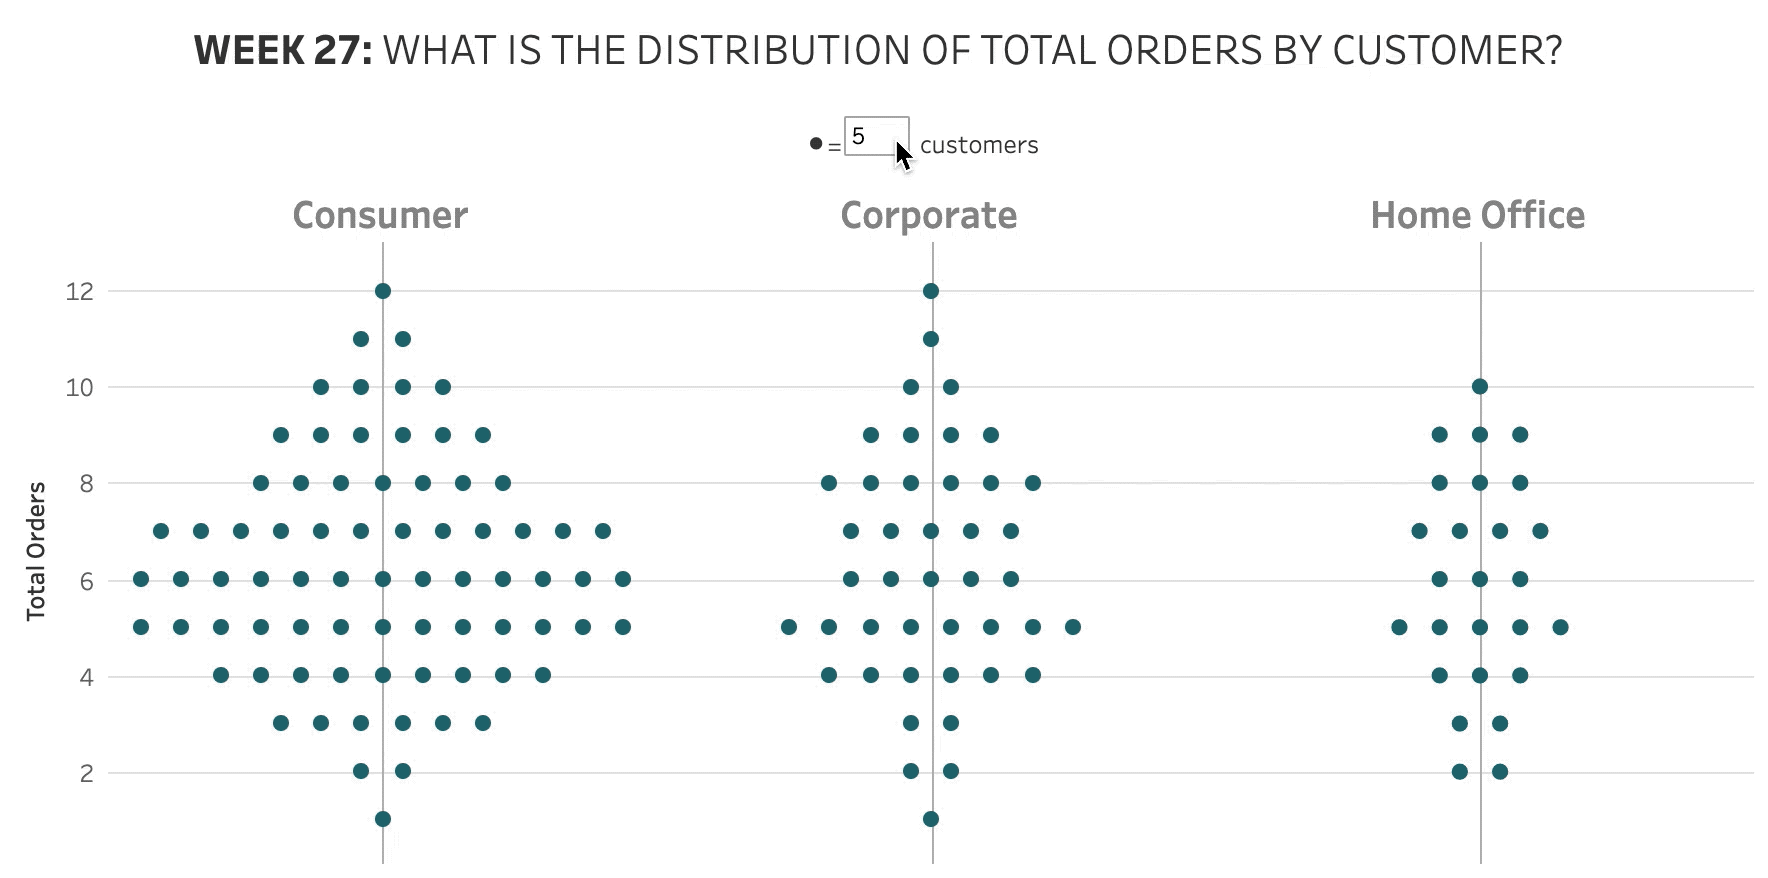
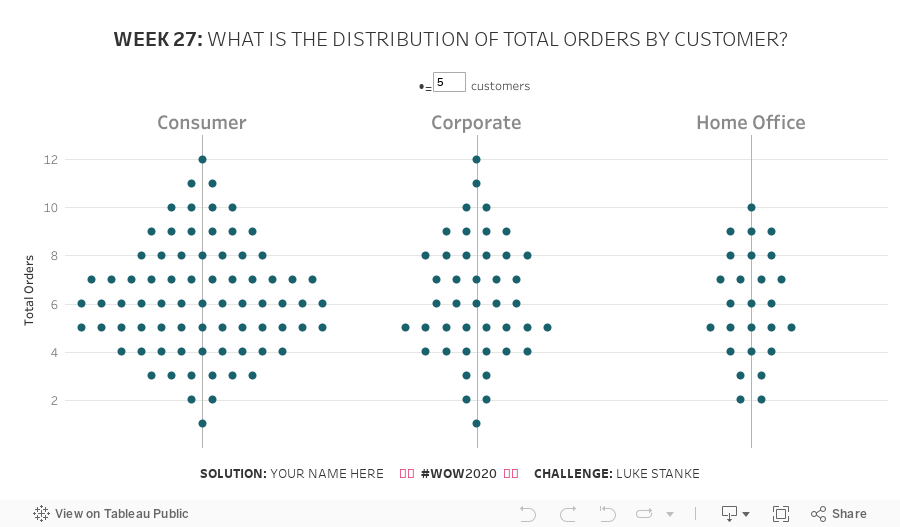
This weeks challenge is to make a symmetrical dot plot. Not only is the dot plot symmetrical but also each dot represents at least some amount of customers. For me, this visualization is about the distribution and making the distribution easy to understand.
For this challenge each dot will represent a subset of a group. For instance if there are 16 people in a group and we have each dot representing 4 customers then there will be four dots. But if there are 3 customers representing each dot then only 5 dots will display.
Have the circles dynamically represent a subset of customers.
Keep it symmetrical.
HINT #1: INDEX() will be useful.
HINT #2: Remember Tableau’s order of operations.
Dataset
This week uses the superstore dataset for Tableau 2019.4. You can get it here at data.world
Attribute
When you publish your solution on Tableau Public make sure to take the time and include a link to the original inspiration. Also include the hashtag #WOW2020 in your description to make it searchable!